

Use Bullish or Bearish Setups Effectively
You’ve heard about the bulls and the bears. You really don’t understand, though, why anyone would choose to name trends after forest and farm animals. Can’t they just say it’s an upward or a downward trend? You have enough trouble with all the other technical terms. Adding animals to the mix just makes things so much tougher.
The good news is that after you’ve finished reading this page, you’ll never again confuse bears and bulls. At least, not in forex trading.
You’ll never forget that the bears are going down while the bulls are going up. You’ll also learn about a few very important engulfing patterns that will help you figure out whether the market is likely to continue the trend or if there’s a reversal waiting to happen.
However, to truly master these patterns, you will have to practice, and there’s no better way to do so than by using historical charts until you’ve become a master.
So, make sure to sign up with one of our top-rated forex brokers and start practicing today. The sooner you get started, the faster you’ll become a more profitable forex trader.
| Broker | Bonus | More |
|---|
Video Transcription: Steps to Make a Profit from Bullish and Bearish Engulfing Patterns
Hello guys, top rated forex brokers here, and we move forward with an interesting strategy to trade. Bullish and bearish engulfing. As you can see on the screen we deal with candlestick techniques and candles, therefore, one of the most powerful candlestick techniques is the engulfing pattern.
(0.21) Before anything you have to imagine this one relates to the stock market. It was invented on the stock market. On the FX market, it worked for years, it still works, but you have to be very careful with the time frame.
(0.39) Because now, the Spread, or the difference between the bid and the ask price, let me show this to you on the MetaTrader. The difference between the bid and ask price is so small that the conditions for an engulfing pattern are not there anymore. Look at the US Dollar and Swiss franc, 97520 to 97527 which is 0.7 Pips. Look at the euro-US dollar. It is 0.3 Pips.
(1.06) It is difficult to create an engulfing pattern on a bigger time frame, because if you look at the weekly chart; so let’s go to the weekly; this is the US dollar and Canadian dollar. Let’s go to the end of it and zoom in.
(1.25) With a bullish engulfing pattern or a Bearish one, you need to have a difference between the opening candle and the closing one in such a way that it will engulf the previous one.
The pattern looks like this. With a Bullish engulfing, (starts to draw) you have the body of a candle, let’s say that this is a candle, and let’s make it red so that we know it is a bearish candle.
(1.56) And then of course a red candle, with a shadow somewhere around here. Let’s make the body of it bigger like this, so this would be a red candle. then the next candle that comes, which is this green one, should totally engulf the red one like this.(green candle on screen)
(2.23) It doesn’t matter the length of the shadow, what’s important is the two bodies here (circles them). This one totally eats into the previous one. For a bullish engulfing pattern like this one, you need a Bearish trend. And then the market, of course, reverses into a Bullish tsunami. The same is valid the other way round.
(2.51) At the top, you have what? At the top, you have a strong Bullish candle followed by an even stronger bearish candle, but a candle that completely engulfs and eats into the previous one. What do we need for a candle to engulf the previous one? A gap.
(3.14) Because if this is the closing of the previous candle. And the opening price of the other one should be a bit higher to totally engulf this one, because if the opening price is here (top right of green candle), then it will not engulf this one.
(3.32) An engulfing pattern is typically a subject for the stock market. Because, when the stock market opens every day there is a gap and therefore the pattern works nicely.
(3.44) But it works on the FX market as well, let me show it to you right here on this US dollar Canadian chart. At the top the 1.46 which is on the weekly chart. The market closed or dies.
(4.00) At the opening, and this is the opening price of the new candle, and you look here at the OHLC, and closing price on the OHLC is 1.4533 and then on the new candle the opening price is 4601 which is 48 pips difference.
(4.30) So the market gets high at the opening of the new week, and closes lower on the trip; totally engulfs the previous candle. Now that is as bearish as bearish can be.
(4.42) This is called a Bearish engulfing pattern, and it shows the start of a new trend. There are two approaches to trade the Bearish engulfing or the Bullish one. To simply measure the length of the stronger candle, then to wait for a pullback.
(5.08) Ideally, you will see a pullback come into its territory about 50% 61.8% but that is not mandatory, and you might end up missing the whole point. Aggressive traders that don’t want to lose such an opportunity will go short at the closing of the second candle.
(5.31) And we will use any opportunity here to ebb on the same position. To know or to have an idea what this means for the overall reversal pattern, then the bigger the timeframe here, the more powerful the reversal will be.
(5.50) In this case, It’s a weekly chart, so if you zoom out and look at the market. So after the Bearish pattern here, imagine you go short here.
(5.59) Stop loss at the highs, even if it is on the weekly chart, the stop loss on the highs would invalidate the pattern, and you still have a risk-reward ratio of 1 to 2 or 1 to 3 for a US dollar pair, and that is quite something.
(6.20) From two simple candles, this is how Bullish and Bearish engulfing work. On the lower time frame it is very difficult, because rarely the market gaps on the hourly chart, for example, when the new candle opens, you have got to be careful with these patterns. Use them from the daily chart and the bar. These are beautiful patterns, so let’s move on to the next video.
While the previous two articles dedicated to the Japanese Candlestick Patterns dealt with the one-candle pattern, this one is treating a three-candle pattern, the star. Stars are powerful reversal patterns that form exactly at the end of a trend. A star is formed out of three candles, with the first one in the group belonging to the previous trend, the one in the middle resembling a doji candle, and the one that follows the doji candle already starting the new trend. There are two types of stars, based on the place the pattern appears, and their interpretation is the same. These patterns are so powerful that strong trends can be identified afterwards.
Types of Stars as Reversal Patterns
Because they appear at the end of a trend, they are reversal patterns, and so can be either bullish or bearish ones. A bullish reversal pattern is called a morning star, while a bearish one is called an evening star.
Generalities of a Morning Star
A morning star pattern is a bottom-reversal pattern. The idea behind its name comes from the fact that it indicates higher prices to come, exactly like the planet Mercury, which shows that sunrise is about to come. There are three candles that form a morning star:
- A strong candle with a large red body
- A small candle in the middle that can be either a doji or a hammer
- A strong candle in the opposite direction that should have a green body.
As can be seen in the description above, the candle in the middle is a reversal pattern of its own, as we described here in the previous articles dedicated to the Japanese Candlestick Techniques. Trading such a pattern is straightforward, like it was in the case when we set up a trading plan for the hammer or hanging man pattern. The idea here is the same: Wait for a little retracement the market should make into the territory of the third candle that forms the pattern before buying after a morning star. In doing this, traders will get a better entry, and this will make up for a better risk/reward ratio further down the road. Speaking of the risk/reward ratio, this one should be a minimum of 1:3, and the stop loss for the long trade should be at the lowest point of the morning star. Usually, this one is given by the candle that forms in the middle of the pattern. Being a reversal pattern, this too is the subject of a terrible battle between bulls and bears, in this case with bears dominating the market. It is only normal, therefore, to wait for a pullback before going long in the direction of the new trend that is about to form.
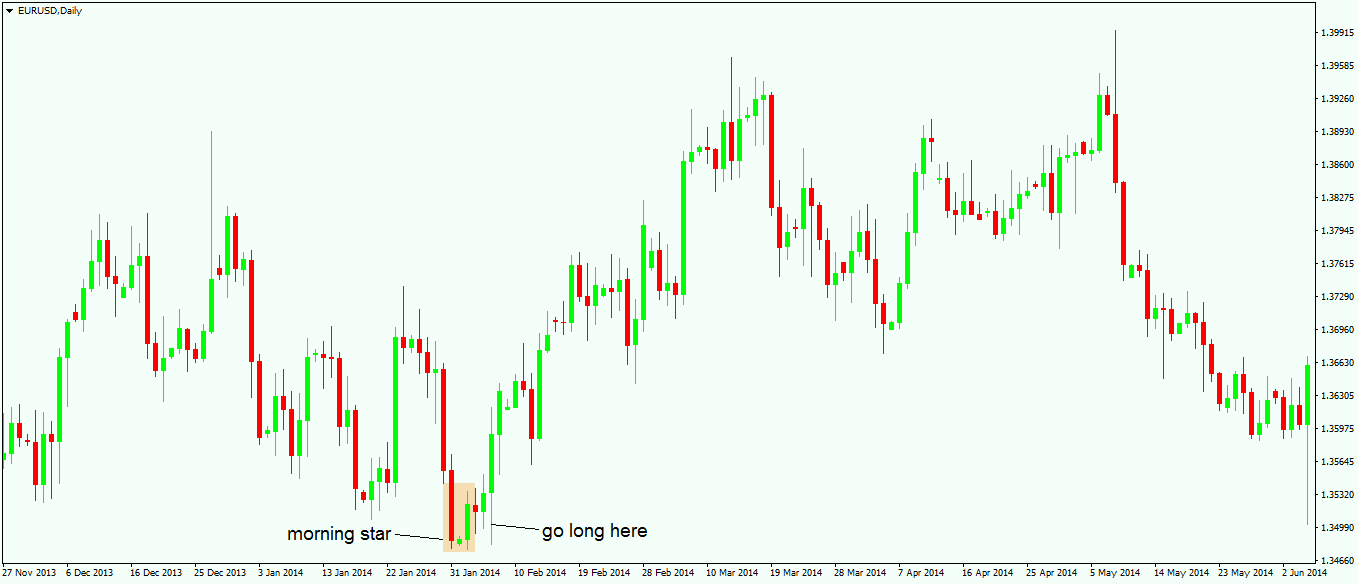
The chart above shows a morning star that forms on the daily chart on the EUR/USD pair, and it respects all the rules of such a pattern mentioned above. The lows of the pattern are not given by the middle candle, but this is not a mandatory thing. The entry on the long side is a better one if the trader waits for a retracement, and the risk/reward ratio is easily met.
Trading an Evening Star
As is the case with the morning star, the evening star is named after another planet, this time Venus, which appears in the sky just before sunset. As the name suggests, an evening star is a bearish pattern, a top reversal one, and shows future lower prices. Both morning and evening stars should have a gap between the bodies of the first and the second candle, but this is not mandatory due to the continuous character of the Forex market. Like in the case of a doji, where it is rarely possible to have the same opening and closing prices, the same thing is valid here with the gap between the first two candles. An evening star, like its counterpart, is formed out of three candles:
- The first candle is a bullish green one.
- The second one is either a doji candle or a hanging man, or something that resembles a mixture of the two.
- The third one is a bearish red candle, with a strong body.
As a rule of thumb, valid in the case of both morning and evening star patterns, the longer the third candle is when compared with the first one in the pattern, the better the chance for the new trend to form. The third candle needs to be a minimum of 50% of the length of the first one.
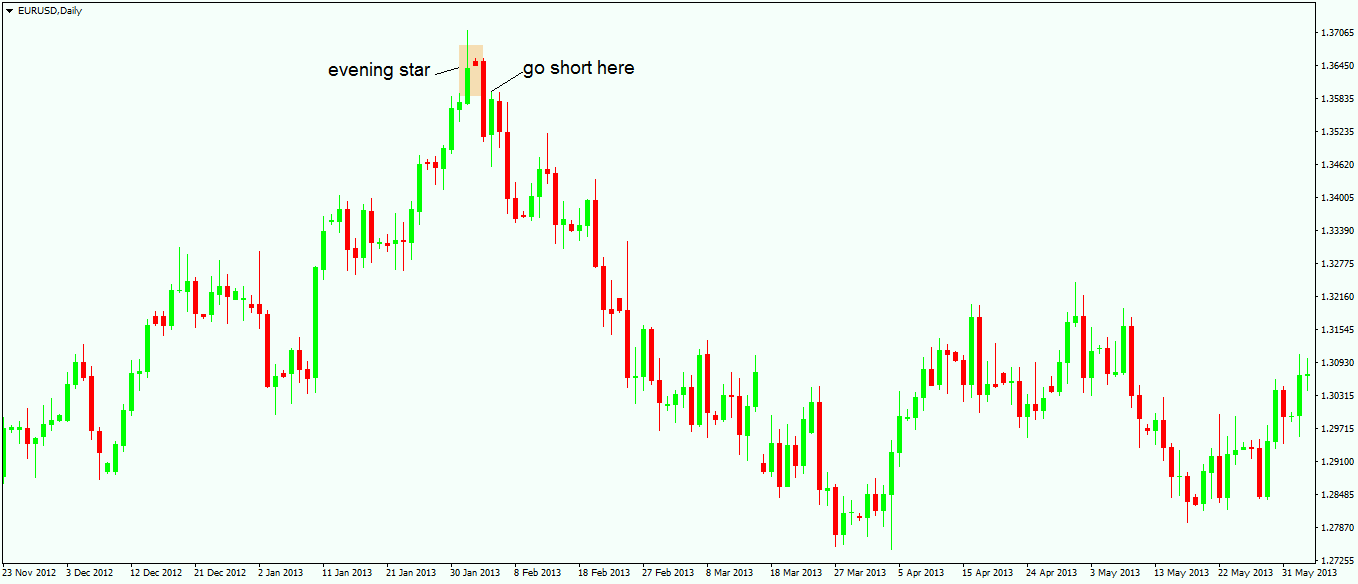
The chart above shows an evening star that has the highest point giving by the first candle, while the third candle is almost double the length of the first one. This is a powerful statement that the bearish trend to follow is a strong one. Nevertheless, trading such an evening star still needs to be the subject of waiting for a small retracement into the territory of the third candle if traders are looking for the perfect entry. This retracement level should be at least 38.2% of the third candle. It should be mentioned here that the arrival of the retracement is not mandatory. Some powerful morning and evening stars are not followed by any retracement, but the risk of going long or short right after the third candle is too big to be ignored.
Another thing to differentiate between different types of morning and evening stars is to consider the middle candle. If that one is a doji, or some candle that resembles a doji candle, then the pattern is more powerful than otherwise. All in all, morning and evening stars are important and powerful reversal patterns, especially if they are seen on bigger timeframes such as the monthly or the weekly chart. The same trading rules should be applied there as well, only that this time the risk/reward ratio would result in nice profits due to the bigger timeframe over which the pattern forms. The last article dedicated to Japanese Candlestick Techniques here on our Forex Trading Academy will deal with explaining a concept that creates confusion among many traders: the difference between the engulfing and piercing patterns. While they are quite similar, a distinction needs to be made.
Other educational materials
- How to Use Parabolic SAR to Buy Dips or Sell Spikes
- Bollinger Bands – Profit from One of the Best Trend Indicators
- Price and Time – The Holy Grail in Trading
- Two Ways to Use Gaps When Trading Forex Markets
- Trade Forex with Fibonacci Retracement Tool
- Trade with Risk-Reward Ratios
Recommended further readings
- “What You Don’t Know About Candlesticks.” Bulkowski, Thomas N. Technical Analysis of (2011).
- BINDABLE CANDLESTICK CHART COMPONENT. Utomo, V. G. (2012). Jurnal Teknologi Informasi dan Komunikasi, 2(1), 35-40.