

How Classical Support and Resistance Levels work in Forex
If there’s ever been a concept widely known in trading, then support and resistance is it. There is virtually no trader who is not familiar with what support and resistance are, and what to do when the market is approaching such an area. As a rule, when meeting support price should bounce, while when meeting resistance it should be rejected. In Forex terms, it means that in a support area traders are looking to buy or to go long, and in a resistance area short trades should be open. Therefore, looking at the principle above and applying the rule on the Forex market seems straightforward and easy to understand and apply. However, there’s a catch: How do we identify support and resistance areas, and how do we know they are going to work for real?


Classical Support and Resistance
Before going into more detail regarding how to trade such areas, there are two things that need to be clarified:
- Any support and resistance area is indeed an “area”, and not just a single/simple level. This means that one specific area is acting as a support and resistance, and when the price is approximately in that area, traders should look to buy or sell.
- Classical support and resistance areas always form on the horizontal. That is, one should take one or more horizontal trendlines, or a horizontal shape, to try to mark such an area on a chart.
Having said that, we’re marking the rules of identifying a classical support and resistance level. Moving forward, there is a saying that any support, once broken, turns into resistance, and any resistance turns into support. Moreover, the longer the timeframe over which the classical support and resistance level forms, the stronger the level and more difficult it is to break.
Using Past Levels to Find Where Price is Hesitating
To identify such areas, traders should always start from the left side of the chart and identify where price hesitated in the past. Whether in a bullish or a bearish trend, the price must hesitate when rising or falling. Those levels should be used to find out a range, and ranges form when the price has multiple support and resistance levels to clear. The example below shows the EUR/USD daily chart when the price fell from the 1.40 when the ECB (European Central Bank) announced it was going to cut the interest rate.
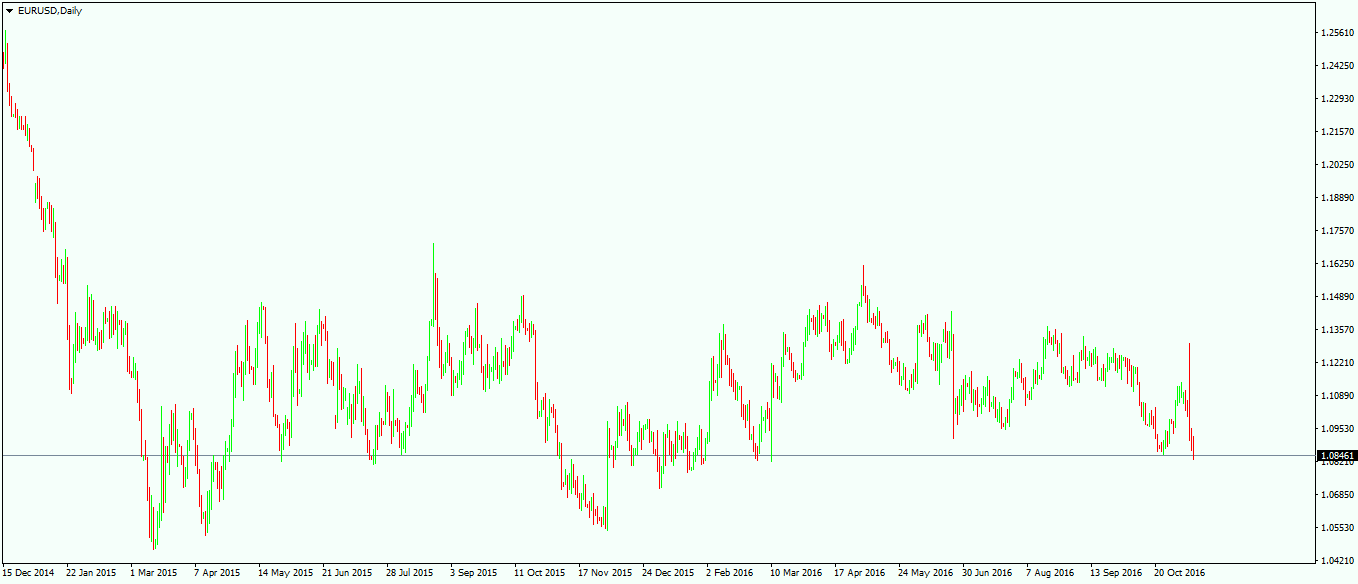
In the end, the cuts were so aggressive that the ECB ended up with the rates in negative territory. This made EUR/USD move downward so aggressively that it seemed that there was no floor below it. However, if you look on the left side of the chart, at one moment in time there is a bounce. (Remember that this is a daily chart and each candle represents a trading day!) This bounce resulted in a consolidation area that took some time to resolve; and from it, we can take the future resistance levels.
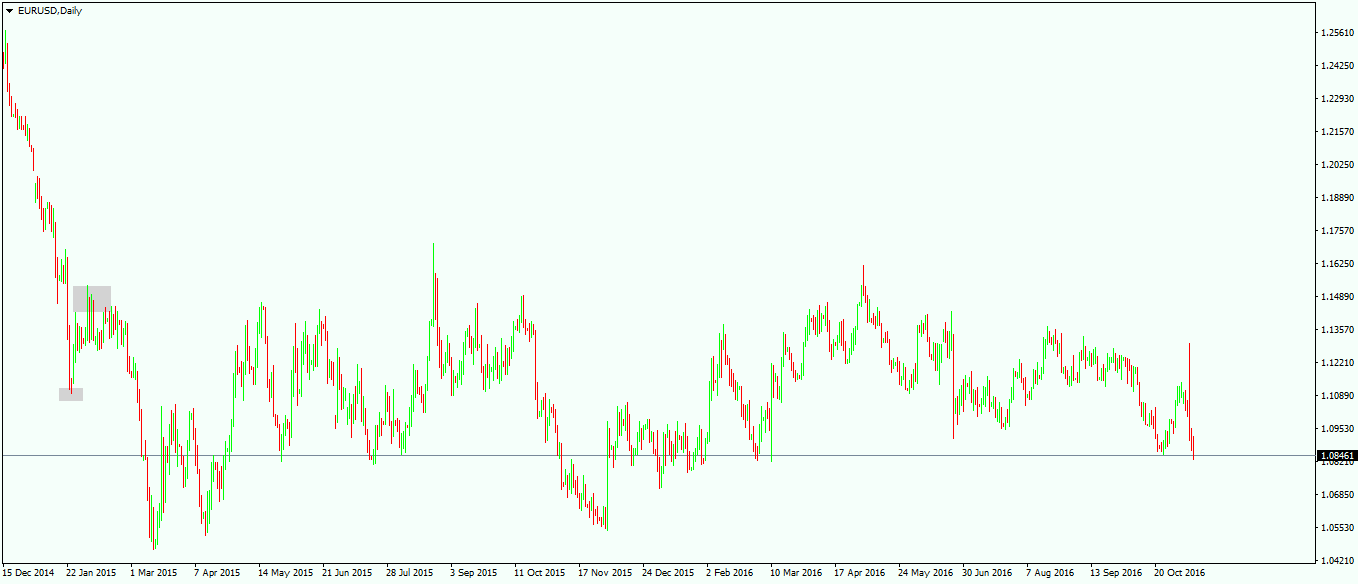
Moreover, on the move to the downside, the price made a low followed by a strong bounce, only to try for a new low. It failed, but in doing that, it gave us the area of support that needed to be cleared for bears to be fully in control.
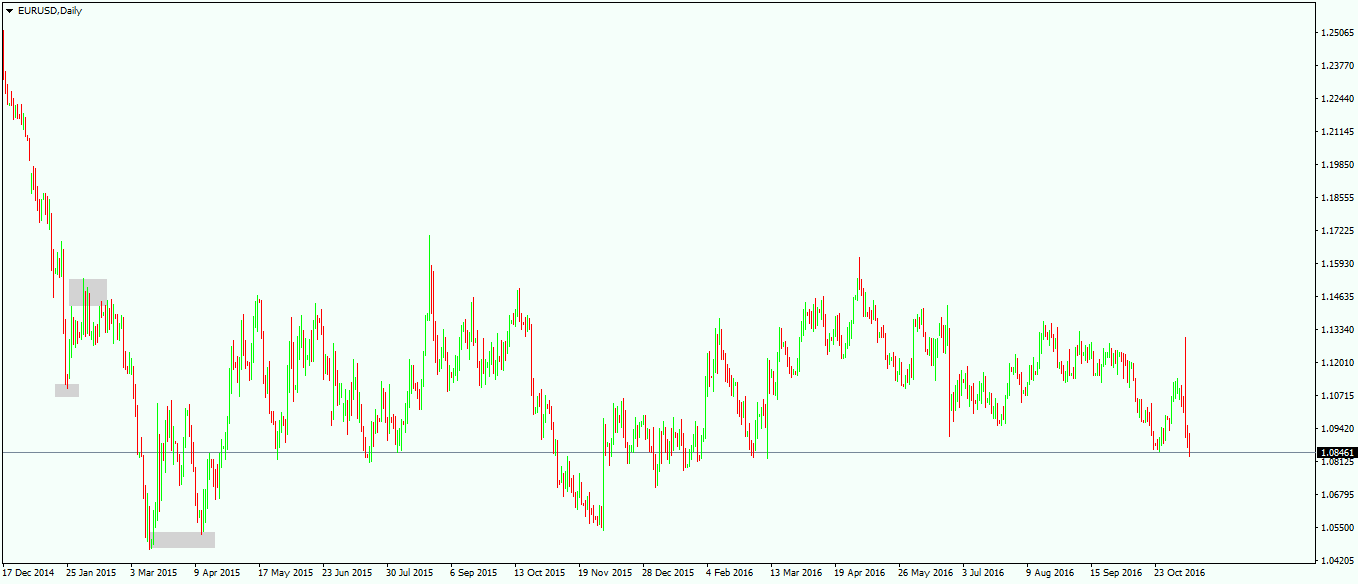
By clicking and dragging these shapes/areas on the right side of the chart, we have found classical support and resistance levels for the period ahead of us. A trader doesn’t know how long the market will take to clear these levels, and, to be honest, it should not matter in the least.
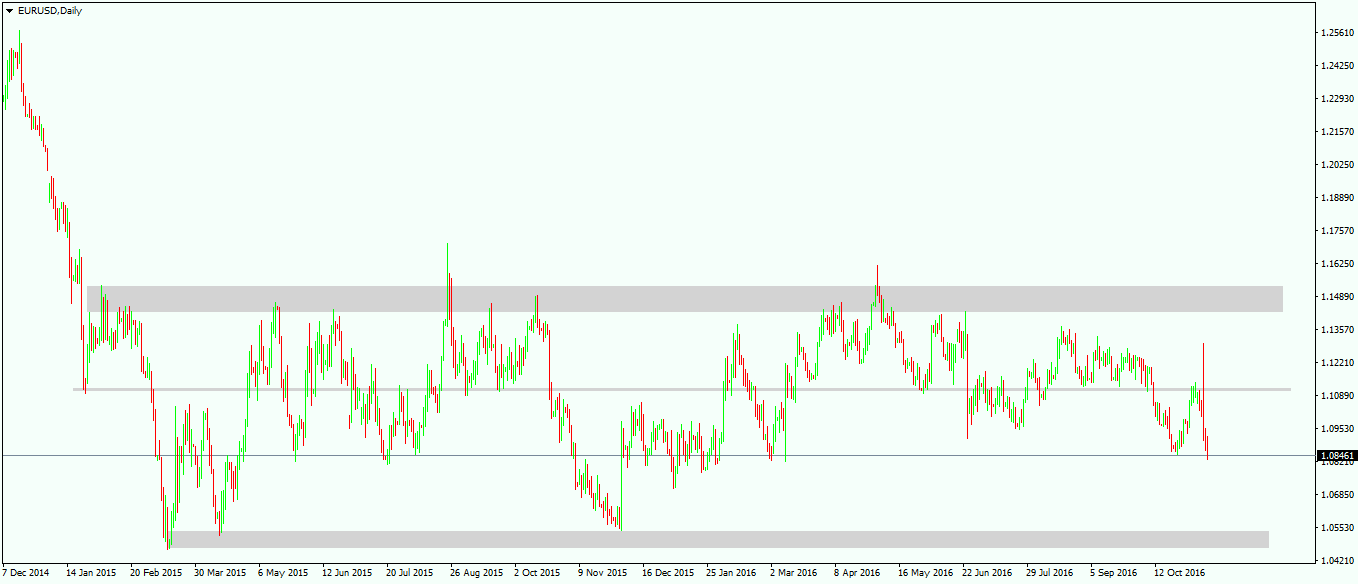
What is important is to be aware that every time the market meets resistance any long trades should be closed, while on support any short trades should be booked. If anything, initiating a counter-trade is the wise thing to do. Looking closely at the chart below, now that we have identified a range given by support and resistance levels, traders have plenty of things to consider. In between these two areas is the original level that was used as the source for this analysis, and that should be considered a pivotal level. Such a level has multiple implications in the sense that every time price is above it, the bias is a bullish one, while when the price moves below it , the bias is a bearish one. Using the example above, the classical support and resistance levels, together with the pivotal level, are still valid, over 18 months after we first made this chart.
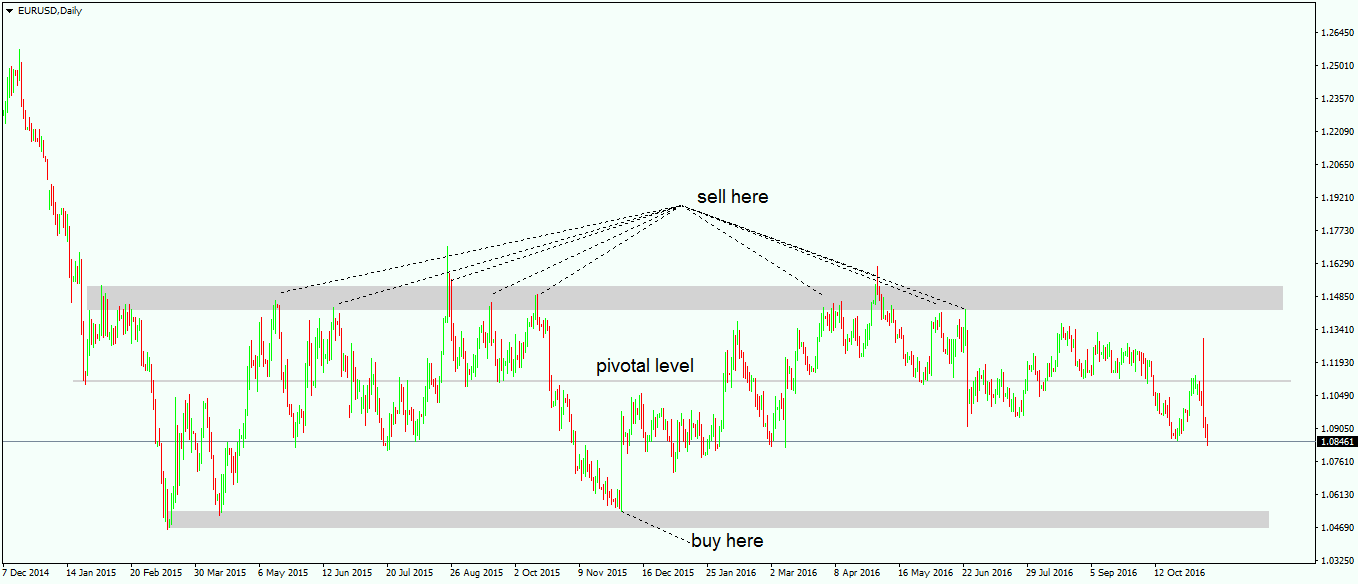
In the meantime, the market offered plenty of opportunities to trade this currency pair, with selling orders being aligned every time the market tried to break the upper side of the range. The pivotal level plays an important role as well as, like mentioned earlier, the bias should shift with every cross that price makes.
Using Oscillators to Trade Classical Support and Resistance Levels
Trading classical support and resistance areas has the advantage of levels being visible, and there is no room for interpretation when the market comes to these areas. If the levels are on longer timeframes, such as the daily chart in this case, then traders have virtually no excuse not to react properly. However, there are some other tools that can be used to make the trading decision as smooth as possible and to remove any doubts. Here at the Forex Trading Academy we have covered multiple oscillators, and how to trade with them. Such oscillators can be used here as well when the price is at a support or resistance area. The chart below shows the Relative Strength Index (RSI) oscillator applied on the same chart as the one above, and the period used is the same as the default one: the 14 one.
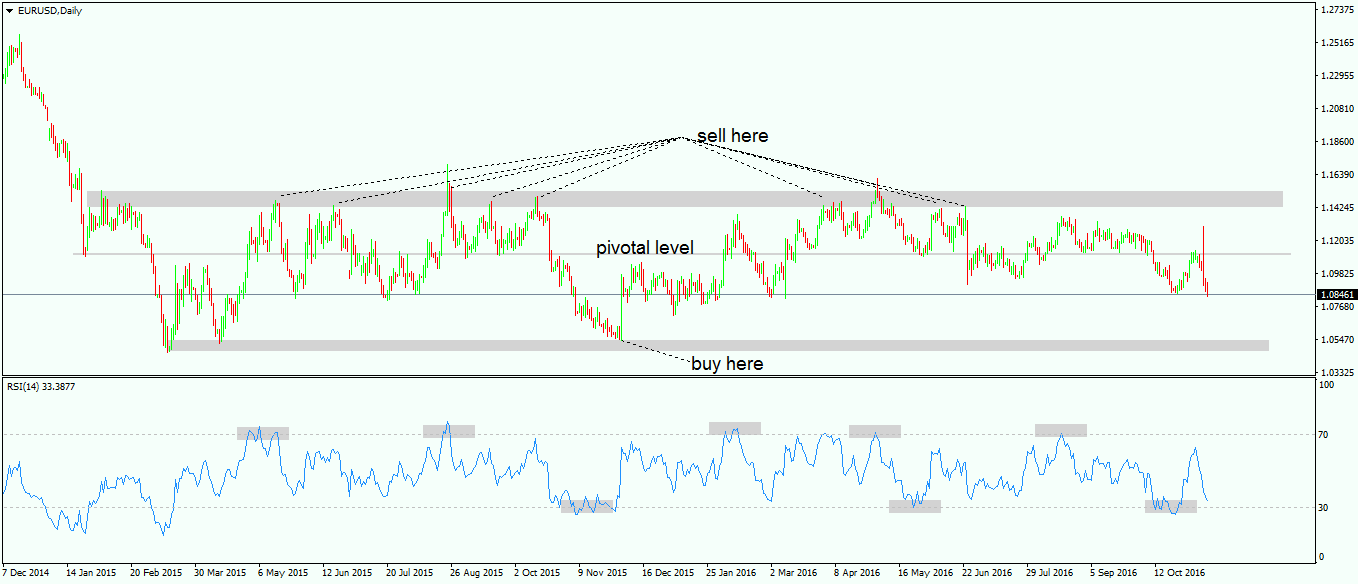
In this case, the RSI is being used in a classical way, to identify overbought and oversold levels. If these overbought and oversold levels happen to form in a support and resistance area, then we have a double confirmation that we should react with a trade. The chart above shows five instances when the price was overbought and at resistance, indicating potential short trades to be taken; and three situations when the price was oversold, indicating that long trades are recommended. Even if a short or a long trade as described above is not traded, at least previous trades should be closed, as a reaction at these levels is supposed to follow. What needs to be remembered all the time is the fact that there is no holy grail in trading, and these areas are somewhat relative: Traders do not know when the range is going to end, nor whether the market is going to react at these levels. What the traders’ focus should be on is money management, and avoiding situations that result in great losses. This can be done by respecting classical support and resistance levels, and patiently waiting for ranges to be broken before engaging in trend trading.
Other educational materials
- How to Use Parabolic SAR to Buy Dips or Sell Spikes
- Bollinger Bands – Profit from One of the Best Trend Indicators
- Pennants as Continuation Patterns
- Price and Time – The Holy Grail in Trading
- Two Ways to Use Gaps When Trading Forex Markets
- Trade Forex with Fibonacci Retracement Tool
Recommended further readings
- Technical trading-rule profitability, data snooping, and reality check: evidence from the foreign exchange market. Qi, M., & Wu, Y. (2006). Journal of Money, Credit, and Banking, 38(8), 2135-2158.
- “An intelligent Forex monitoring system.” Abraham, Ajith, and Morshed U. Chowdhury. In Info-tech and Info-net, 2001. Proceedings. ICII 2001-Beijing. 2001 International Conferences on, vol. 3, pp. 523-528. IEEE, 2001.
Related Articles