

The Golden Ratio in Complex Corrections – Trader’s Guide
The golden ratio, or the 61.8% retracement level, is the most important Fibonacci ratio, with a wide use in multiple aspects of all parts of the world that surrounds us. It is no wonder that the overall Elliott Waves theory is based on this golden ratio, with virtually all important decisions that a trader must take being influenced by it. Let’s start with the logical process that should govern a trader’s approach when counting waves with the Elliott theory. The first question one should ask is whether the overall move the market makes is impulsive or corrective. Answering this question already leaves behind the other possibilities, and a trader should focus on a more in-depth analysis based on that answer. If the move is considered to be an impulsive wave, then it should be retraced before an extension that is most likely around 161.8% of it. That being the case, it means, using reversed logic, that the first impulsive wave is actually 61.8% of the bigger impulsive wave. The golden ratio is therefore present in impulsive waves. If the answer shows that a corrective wave is going to form, then the very next question is to identify what type of a corrective wave it is: a simple or a complex one. If it is a simple one, then it can only be a flat, a zigzag or a triangle. We have so far covered all the simple corrective waves, and we know that the key in both flat and zigzags patterns stays with the 61.8% retracement the b-wave makes into the territory of the previous a-wave. Again, the golden ratio comes to define the patterns. The same applies in the case of zigzags and, in a way, for specific triangles, the golden ratio gives the nature of a triangle when interpreting the retracement level of the same b-wave in the territory of the previous a-wave; but this is a subject that will be treated on another occasion. What if the simple correction is actually not confirmed, and the logical process is leading us to a complex correction? In this case, the golden ratio is even more powerful, if such a thing can be said.
| Broker | Bonus | More |
|---|
Trading Complex Corrections with the Golden Ratio
Before even starting, it should be mentioned that it is NOT even possible to trade a complex correction without using the golden ratio, as the whole trading set-up/strategy is based on it: Either the price reaches this level or it does not. If yes, specific things need to be done; if no, other things will have to be done. In both cases, the answer comes from the 61.8% level. However, the tricky part is where to measure the waves from. Different answers give different levels, and this is where the confusing part lies.
Defining the Complex Correction
 Based on what has been said above, it is no wonder that we can define a complex correction based on the golden ratio. How do we do that? If you followed all our Elliott Waves articles dedicated to the subject here on the Forex Trading Academy, you’ll know that a complex correction never starts with a triangle. So there are only two other options left: a zigzag or a flat. This is very important, as the overall complex correction can be defined based on what the first corrective wave is. It is either going to be a complex correction that starts with a flat, or a complex correction that starts with a zigzag. There’s no other way around it!
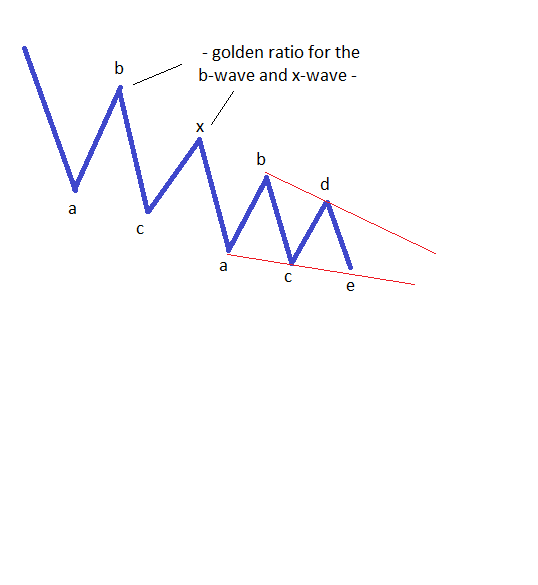
While this may not look very important at this stage, it will turn out to be critical, as these two complex corrections will have a different channelling component; therefore, we have to know what the nature of the first correction is. This is given by the retracement level the first b-wave makes into the territory of the previous a-wave. In a flat, the b-wave should end beyond the 61.8% retracement level, while in a zigzag, the b-wave should end before that level. Once again, the golden ratio comes in handy in identifying the nature of the complex correction. This, in turn, will allow an educated guess regarding the length of the complex correction (both in price and time!) and when to enter and exit a trade.
Trading the X-Wave
By the time the nature of the first correction is known (either a flat or a zigzag), one should refer to the types of flats and zigzags in order to identify the exact type that has formed. This is important as it will give us the end of the pattern and the possibility of taking a trade in the other direction, as an x-wave is coming. The x-wave, as a connecting or intervening one, is always corrective, and it should be interpreted based on the type of the first correction. If the first correction was a zigzag, then it is mandatory for the x-wave to be a simple correction. If, on the other hand, the first correction was a flat, the x-wave can be either a simple or a complex correction. Moreover, bringing the golden ratio into the discussion, all eyes should be on the length of the x-wave. If this one stretches beyond the 61.8% level, the market is forming a complex correction with a large x-wave; and if not, a complex correction with a small one. Both are different, and open the gates for different patterns and different trading plans.
Other educational materials
- Contracting and Expanding Triangles
- How to Use the Apex of an Expanding Triangle
- Trading with the Apex of a Contracting Triangle
- Types of Contracting Triangles
- Special Types of Triangles
- Types of Expanding Triangles
Recommended further readings
- Candlesticks, Fibonacci, and chart pattern trading tools: a synergistic strategy to enhance profits and reduce risk. Vol. 209. Fischer, Robert, and Jens Fischer. John Wiley & Sons, 2003.
- ALGORITHM TRADING IN & FOR THE FOREIGN EXCHANGE. Quinn A.
Related Articles