

Elliott Waves Theory – What Are Corrective Waves?
Corrective waves are three-wave structures that move in the opposite direction to an impulsive wave. Such corrections can either be simple or complex, and they tend to form more often than impulsive waves. This is an understatement, as logic will say that if in an impulsive wave there are only two corrective waves, the second and the fourth one, it means that there are more impulsive waves of a lower degree. While this is true, in reality, the two corrective waves mentioned above are much more time-consuming than the impulsive waves. Moreover, any five-wave structure is followed by an a–b–c, and this is a correction as well. Out of these three waves, the a–b–c, it is mandatory for the b-wave to be corrective, and based on its retracement level into the territory of the previous a-wave, we can correctly label the whole pattern.
| Broker | Bonus | More |
|---|
Simple and Complex Corrections
Elliott found that corrective waves can be either simple or complex, and this serves to further divide the theory. If the market forms a simple correction, the move to follow must confirm it. If the simple correction is not confirmed, it means that the market has formed a complex correction.
Answering that question is vital for moving forward with the correct interpretation of the whole count. A complex correction calls for another corrective wave to follow, while a simple one calls for the whole correction to be completed and a new impulsive wave to start.
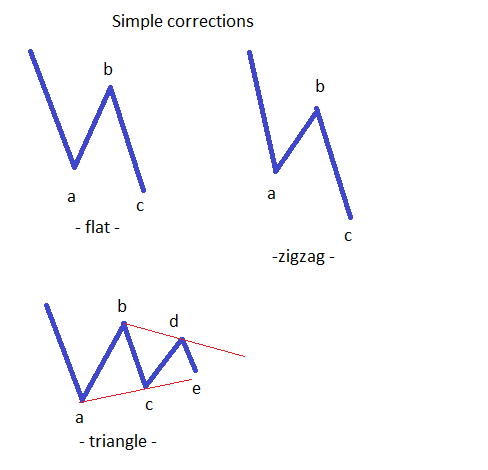 There are three types of corrective wave: zigzags, flats, and triangles. They are all called three-wave structures, even though the triangle, in reality, has five waves. However, because all those five waves are corrective, it is said that the whole triangle is a three-wave structure. In other words, the market may form an impulsive wave followed by a zigzag or a flat, or a three-wave structure as the a–b–c to follow the 1–2–3–4–5 impulsive wave. If that is the case, it is said that the market has formed a simple correction. Once again, the key when counting with Elliott Waves comes from being able to differentiate between different degrees, and how to see that in the overall perspective. A simple a–b–c structure may be the second wave in an impulsive move, or the fourth wave, or simply the a-wave in a flat or triangle.
Complex Corrections
This is the most complicated part of the whole Elliott Waves theory. Rules and types of impulsive waves are simple and easy to understand, but complex corrections are a totally different story. While the previous statement may scare many Elliott wannabees, logic should prevail here as well. There is a logical process to use when treating a complex correction, and one should start with the very basic stuff. The starting point should be the fact that a complex correction is formed out of multiple simple corrections. If the simple corrections are zigzags, flats, and triangles, it means that a complex correction is formed out of variations of these simple corrective waves.
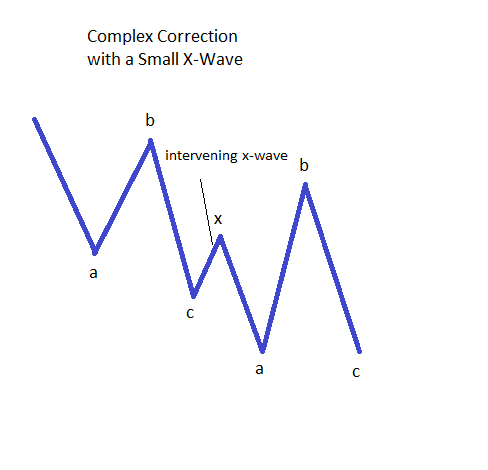
Elliott found that it is not possible for a complex correction to have more than three simple corrections of a lower degree, and this, in a way, limits the possibilities we have for such corrections. Using probabilities, combining zigzags, flats and triangles mean forming complex corrections. However, something is missing. How do we combine such patterns in order to form complex corrections? The missing link is called an x-wave, and this is an intervening wave, or a wave that comes and connects two or three simple corrections that form a complex one. As a rule of thumb, an x-wave is always a corrective wave of a lower degree, and it holds the key to correctly interpreting the whole complex correction. Therefore, an example of a complex correction can be the following: zigzag–x-wave–flat. The previous complex correction mentioned above has the following structure: a–b–c – x wave – a–b–c. In this structure, waves a and c of the first correction are impulsive waves, while the b wave is a corrective one. The x-wave is either a simple or a complex correction in its own right, while the last a–b–c has a corrective structure for waves a and b, and the c-wave is an impulsive wave.
The whole complex correction therefore has at least three impulsive waves of a lower degree. Based on the nature of the x-wave, the more impulsive activity can be found. However, it is only one of a lower degree. Complex corrections are further divided based on the length of the x-wave, specifically on the retracement level the x-wave makes into the territory of the previous correction. From this point of view, there are corrections with a small x-wave and corrections with a large x-wave.
It is not possible to have more than two x-waves in any type of a complex correction, and this is something that many traders fail to understand. Even if the market seems to form more swings and gives the impression that the correction will never end, chances are those swings are legs of a triangle. A very good example of a complex correction is the one mentioned a bit earlier, and that one is called a double combination. Such a double combination always has a small x-wave, so we know from the start the maximum retracement level for the x-wave. To sum up, in order to fully understand how corrective waves form and how to interpret them, it is mandatory to link this article with other ones here on our Forex Trading Academy project. This is the only way to come up with the logical process that makes Elliott Waves theory so popular among traders. A strong understanding of corrective waves holds the key to correctly counting waves with Elliott, due to the fact that markets spend most of the time in corrective waves. Add to this the fact that even within corrective waves there are impulsive waves of a lower degree, and you’ll have a fairly good picture of the complexity of this trading theory.
Other educational materials
- Defining Impulsive Waves
- Defining Corrective Waves
- Use the Fibonacci Extension Tool in Elliott Waves Theory
- Different Fibonacci Levels Important When Trading with Elliott
- Trading Different Types of Extended Waves
- Placing Pending Orders When Trading with Elliott
Recommended further readings
- A study to understand Elliott wave principle International Journal of Engineering Research and General Science
Volume 4, - Prediction by means of Elliott waves recognition. In Nostradamus: Modern Methods of Prediction, Modeling and Analysis of Nonlinear Systems Volna, E., Kotyrba, M., & Jarušek, R. (2013). (pp. 241-250). Springer Berlin Heidelberg.
Related Articles


