

Trade Forex with the Fibonacci Retracement Tool
The Fibonacci numbers are having a wide use in technical analysis and there are multiple trading theories that are based on them. One of the most important trading theories, the Elliott Waves theory, is based entirely on the Fibonacci levels, both for finding out extended waves as well as for classifying corrective ones. Various Forex trading platforms are having the Fibonacci numbers incorporated and there are several tools to be used: Retracement, Expansion, Arcs, or Time Zones. Out of all the Fibonacci tools, the retracement level is the most popular one and the one that is used in various ways. So far on our Forex Trading Academy project we discussed both the Fibonacci tools as well as their application to the Elliott Waves analysis. However, the Fibonacci retracement tool has one more application: finding out the so-called Fibonacci confluence areas, or clusters.
| Broker | Bonus | More |
|---|
Using Fibonacci Retracement to Find Confluence Areas
The idea behind a Fibonacci confluence area or a cluster is that it represents a strong support or resistance level that is very difficult to be broken. If two or more Fibonacci levels are forming around a specific level, that area is a confluence area and supply and demand should be significant. The Fibonacci retracement tool, in this case, should be used on the bigger time frames and the proper one to start is the monthly chart. Again, the usual caveat applies here as well: the bigger the time frame, the stronger the support and resistance area is and the more difficult for the price to clear that area.
Fibonacci Levels to be Used
However, not all Fibonacci levels are meaningful, and to avoid having too many lines on the screen, the most important ones should be used. In the order of their importance, the 61.8%, 50%, and 38.2% are the levels that should be used to find out Fibonacci clusters. As mentioned earlier, the time frame to start in the first place is the monthly time frame and the chart below shows the EURUSD pair. The thing to start with is to look at the highest and lowest point on this time frame and then use a Fibonacci retracement tool to find out the levels mentioned above. 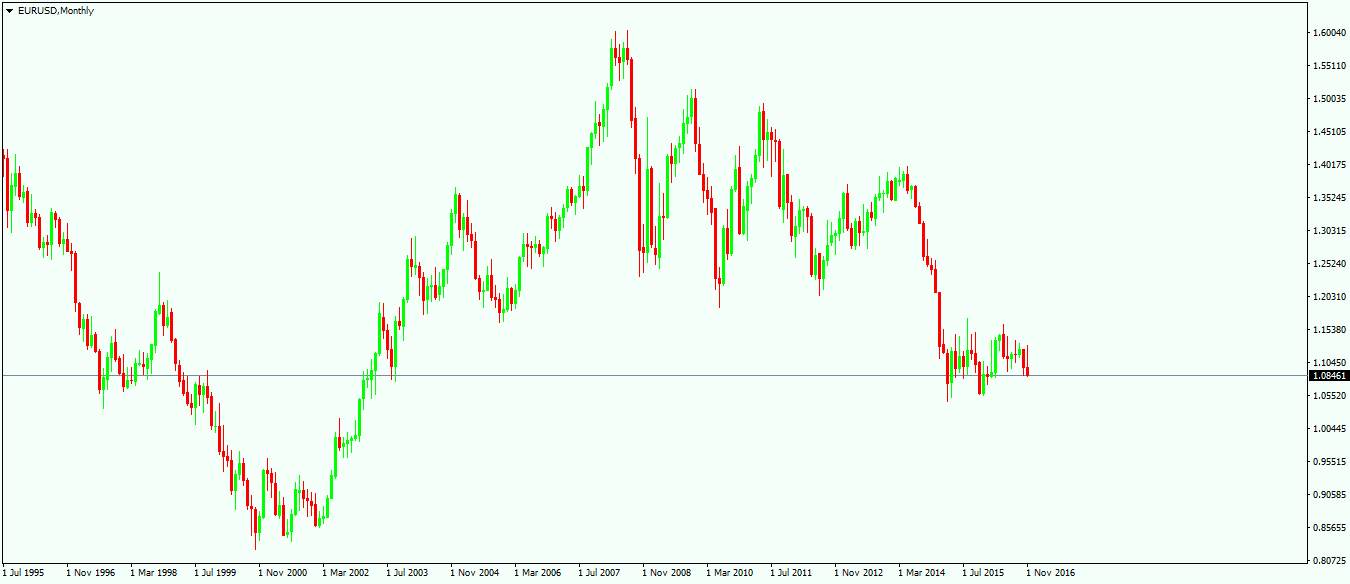
Before doing that, please consider the following: do not simply drag the Fibonacci retracement tool from the highs to the lows, as the chart will be too crowded, having too many lines. To avoid this, simply take two horizontal lines to mark the highest and the lowest point in the chart and then use the Fibonacci retracement tool on the vertical, like it is represented on the chart below.
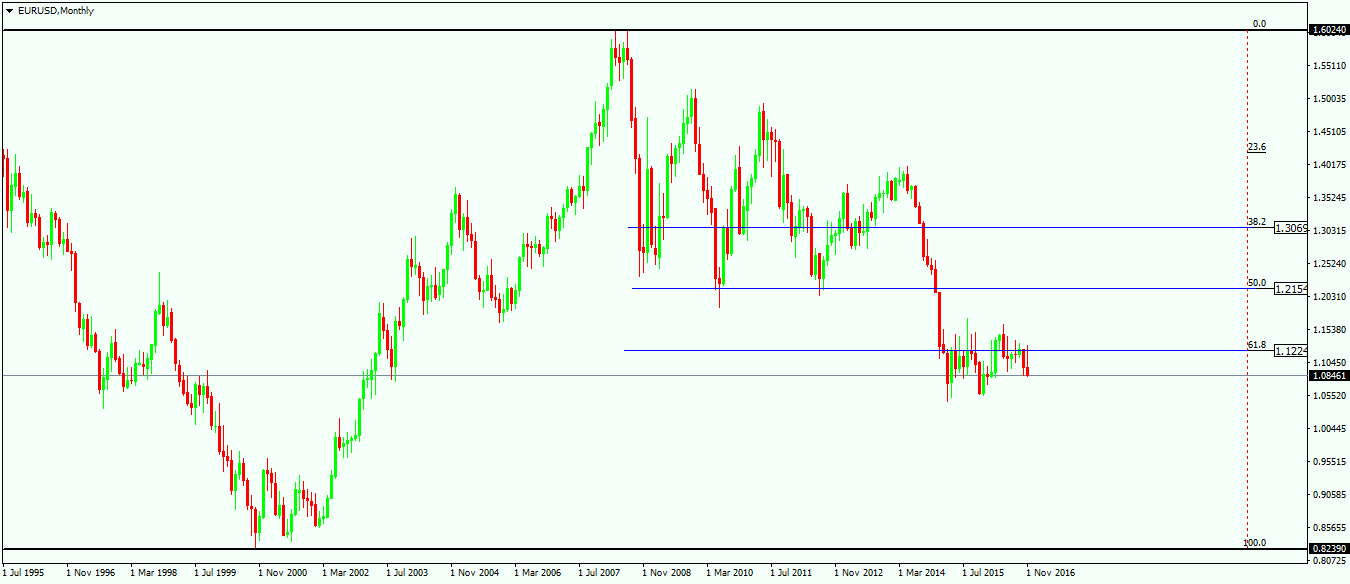
Because the market made the higher value after the lower one, it means price retraced, and the Fibonacci retracement tool needs to be dragged in such a way to show support levels on any move lower. The same thing that is valid for support and resistance areas is valid here as well: by the time the support is cleared, it becomes resistance and the other way around. The chart above shows again the important of the golden ratio, or the 61.8% level, as the price is consolidating around that level for quite some time now. To be more exact, there are twenty months/candles that price used to clear that area, and, at the moment this article is being written, the area is still not cleared as the 1.1220 level still attracts price. On the move to the downside, the 38.2% and the 50% one where difficult to be cleared as well, as price hesitated multiple times at those levels. However, there is more to be done for finding out cluster areas, as so far these are only some levels on a chart.
Use the Lower Time Frames
To find out confluence areas, one needs to use the lower time frames as well. There is no need to move on the daily chart, so weekly and daily time frames should be enough for these important areas to be found.
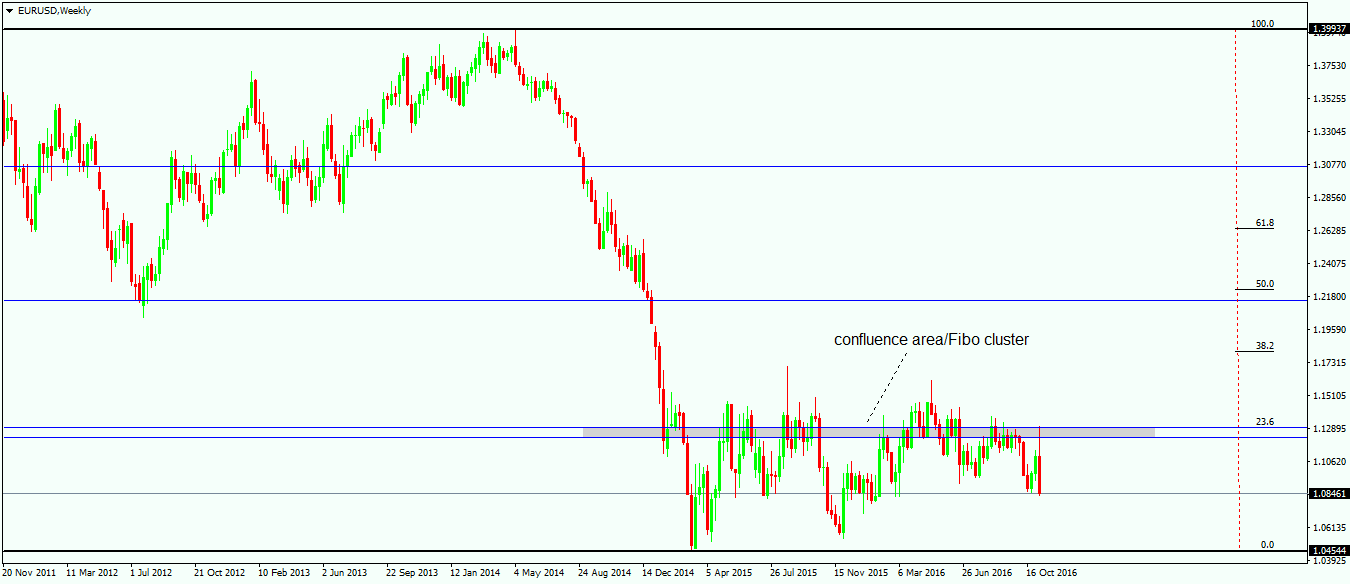
Using the same principle as the one for the monthly chart, the weekly chart looks like above. The three Fibonacci levels from the monthly chart are represented here as well, and the Fibonacci retracement tool is dragged from the highs to the lows on this time frame. The idea behind finding confluence areas is to look for one or more Fibonacci levels to come around the same place. In this case, the 23.6% level one the weekly chart is closer to the 61.8% level on the monthly chart. The area between the 23.6% and the 61.8% is a confluence area or a cluster one, and we can see that price reacted quite some time around these levels. On the move lower, the whole drop from the 1.40 saw market hesitating for more than five weeks before clearing the support provided by the Fibonacci cluster. By the time the support has been cleared, the cluster area turned into resistance and every time price came back to test it, traders should look to sell the pair. So far the cluster worked amazingly and still works as, whatever the fundamental news surrounding the pair, the market is not able to break the resistance level provided by the confluence area. And this doesn’t mean that there were not important enough events to move price. To be honest, there were plenty of reasons for the market to move, starting with the Brexit vote and ending with the U.S. Presidential election, but market failed at the Fibonacci cluster. This is the perfect example of how powerful such cluster areas are, and keep in mind that this area is being given by only two Fibonacci levels. In some cases, three or even more Fibonacci levels can be identified in a specific area, making it difficult for the price to clear the supply and demand surrounding that level. Following up on the EURUSD example, the next thing to be done is to go on the daily chart now, find the highs and the lows in that time frame, and look for the important Fibonacci numbers again. If another Fibonacci level comes up around the highlighted area, it means that the area is even more difficult to be broken. What if price ends up breaking the resistance? Well, the resistance turns into support and every retest should be used as an opportunity to go long and look for higher levels.
Other educational materials
- Geopolitical Risks That Influence Markets
- Different Trading Styles
- Trading with the Cloud – Use Ichimoku Cloud to Spot Reversals
- Dynamic Support and Resistance Levels in Forex Trading
- A Guide for Trading Rising and Falling Wedges
- How to Draw a Trendline
Recommended further readings
- “Introduction to the foreign exchange market.” Gaucan, Violeta. Journal of Knowledge Management, Economics and Information Technology 1, no. 1 (2010): 1-14.
- “Forecasting Foreign Exchange Market Trends: Is Technical Analysis Perspective Successful?.” Roudgar, Esmaeil. PhD diss., Eastern Mediterranean University (EMU), 2012.
Related Articles