

Buy Dips or Sell Spikes with Parabolic SAR
Parabolic SAR is just another trend indicator offered by default by any trading platform, and the overall idea when trading with this indicator is to make sure you end up on the right side of the market, or, simply put, to follow the trend. Even though it is considered to be a lagging indicator, traders find tremendous value when trading with it. As is the case with all trend indicators, this one is used to identify places to trade in the direction of the general trend. It is not wise to use it to spot trend reversals, as it is simply not built for this purpose. The Parabolic SAR was developed by Welles Wilder, the same guy who developed the world-famous Relative Strength Index (RSI). The SAR acronym stands for “stop and reverse”, but nevertheless, the indicator is a trend one. Having said that, if it is applied to a chart and if the trend is a bullish one, one will see some “dots” below the actual price, indicating that the price is going to move to the upside. The same is true on a bearish trend, only this time the dots will indicate a bearish trend. In other words, if a dot is placed above the price, this is considered to be a bearish signal, while a dot that appears below the price is a bullish signal. Buying and selling with the Parabolic SAR indicator is not that easy or straightforward, though, as you will see in the rest of this article.
| Broker | Bonus | More |
|---|
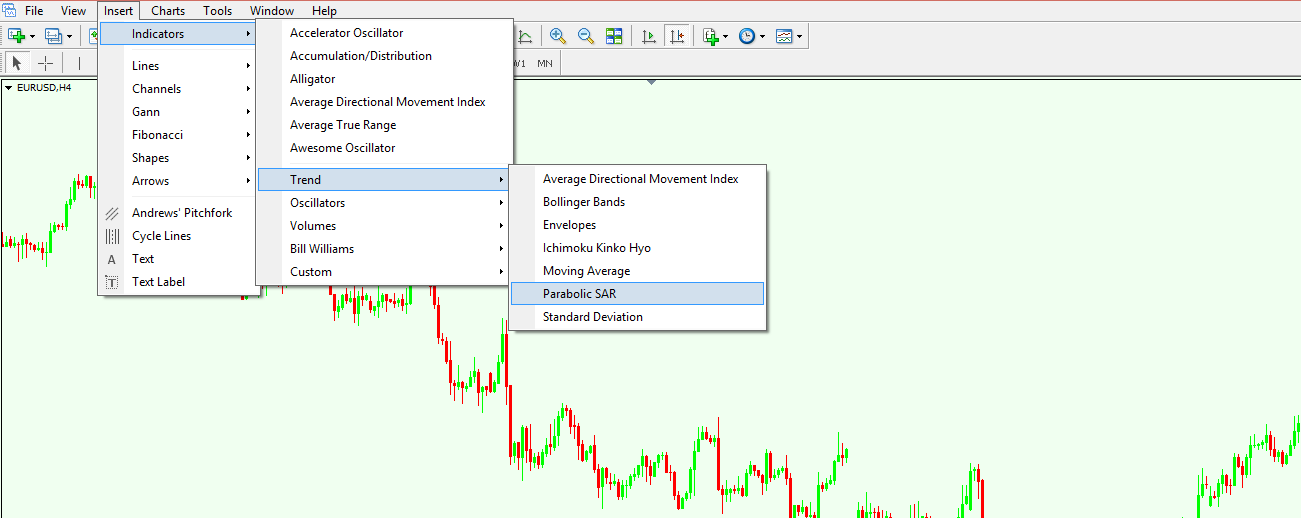
To apply the Parabolic SAR to a chart, you need to click the Insert tab on the MetaTrader 4 platform, then choose Indicators, Trend, and the Parabolic SAR will open.
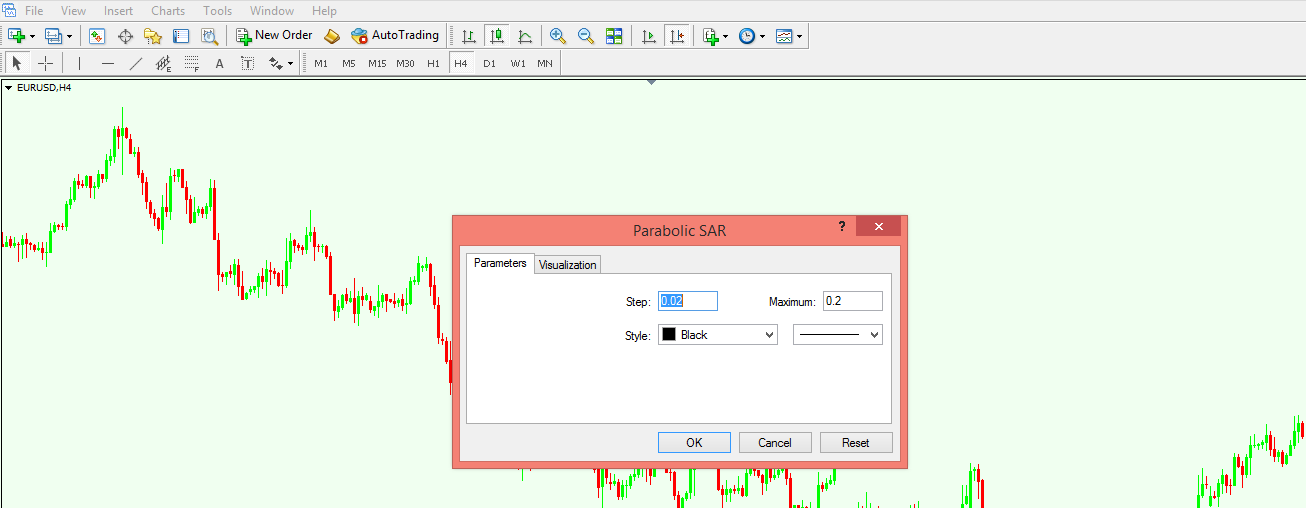
After choosing the indicator, a pop-up window appears asking you to set the parameters. You can choose the colour, the size of the dots to be applied, and even the period to be taken into consideration when applying the dots.
Ways to Use the Parabolic SAR Trend Indicator
There are two main ways to use the Parabolic SAR indicator, the best-known one being to apply the indicator on a reasonable timeframe (from the hourly timeframe and longer) and trade with a short-term horizon based on the overall trend. In other words, scalp your way for short profits based on the longer trend direction. The other way to use this indicator is to time the exit from a trade that was profitable. It doesn’t matter what the logic behind that trade was, as long as it ended in profit. Being a profitable one, the next question that comes to mind is when to exit the trade in such a way that the trend is not missed. This is where the Parabolic SAR comes into play, as it allows traders to trail their stops for profitable trades in order to time the exit.
Buying Dips/Selling Spikes with the Parabolic SAR Indicator
Using the indicator with this approach implies that a trend is already in place, and that traders are looking to identify places to trade in the general direction of the overall trend. This usually means scalping when markets are correcting the overall trend, with the purpose of realising some profits on a short timeframe.
Identifying a trend can be done using either moving averages (as described in another article here at Forex Trading Academy, this can be done by using golden and death crosses) or simply using the very definition of a trend: a series of higher lows/lower highs that is not broken. The next thing to do is to apply the Parabolic SAR indicator on the chart in order to see the underlying main trend. The chart below shows the EUR/USD 4-hour timeframe with the Parabolic SAR indicator applied.
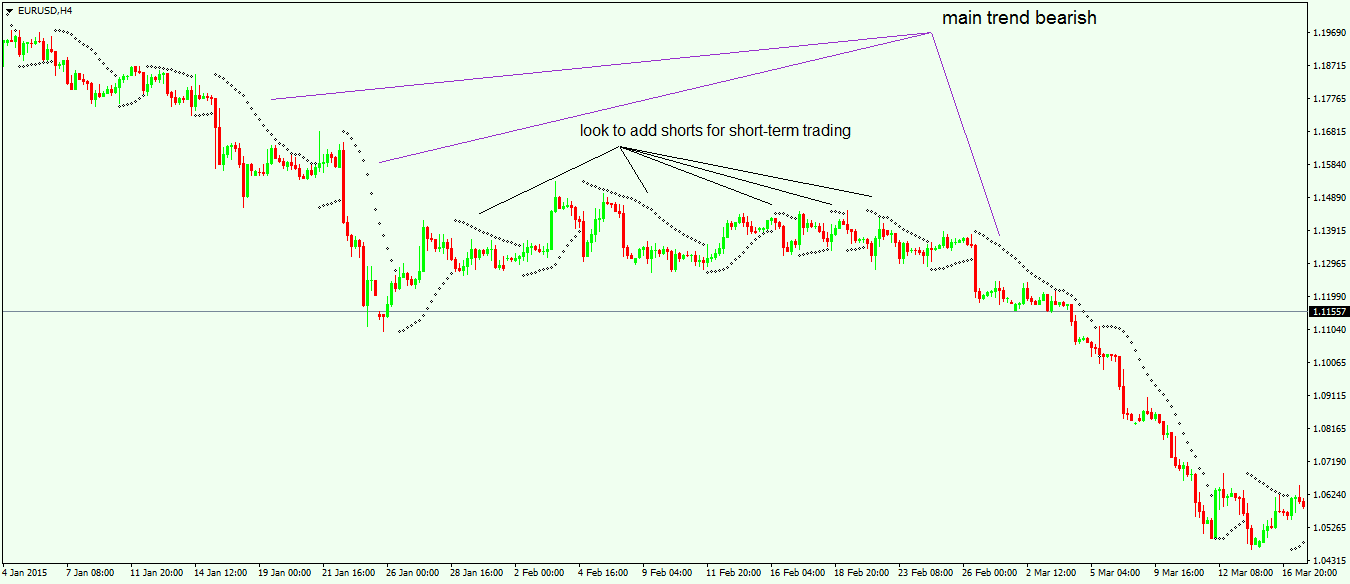
It is obvious that the main trend is a bearish one, but this is not necessarily a conclusion offered by the Parabolic SAR. What traders do is use it in order to trade in the same direction as that of the general trend, but when the price is consolidating. In the example above, given the fact that the main trend is a bearish one, all we have to do is to look for shorting the pair for short-term to very-short-term profits. This is called scalping.
As mentioned at the start of the article, a dot plotted above price means a bearish environment, and represents a bearish signal. Traders therefore look to go short on the first bearish dot after a bullish signal, having in mind that the trade is short-term oriented. The chart above shows no less than six possible short trades if we count the one when the main bearish trend resumes, and they represent a way of making a profit when the market is in a range.
Using the Parabolic SAR to Trail Stops
Exiting a trade is as important as entering one, as traders often exit a trade only to find out that the price starts moving even more aggressively in the right direction. One way to avoid this is to trail your stops with the Parabolic SAR indicator. To do that, it is assumed that there is already a trade that is well into profit. This trade may have been taken by considering some other indicators or trading theories, and now the question is when to exit it. For that, the Parabolic SAR is applied on a shorter timeframe, ideally not shorter than the hourly chart. If the trade is a long one, meaning the trend is a bullish one, the Parabolic SAR indicator will show the dots below the price. The idea behind trailing the stop is to raise it with each and every dot that is also rising, as this means the overall price is still moving to the upside. When the dots move above the price, that is a signal that the trade should be closed. In this way, the risk of a sudden trend reversal is avoided, and if the Parabolic SAR dots move above the price it means the overall trend might end, so it is safe to exit the trade. Even though it is considered to be a trend indicator, the Parabolic SAR is mainly used as an extra tool in a trending environment. This doesn’t change the fact that it represents a valuable tool for profitable trading.
Other educational materials
- Three Ways to Trade Forex with CCI (Commodity Channel Index)
- Overbought and Oversold Areas in Ranging Markets
- Profit from DeMarker Divergences
- Forex Trading Accounts and the Value of a Pip
- The Importance of Swap and Spreads
- How to Enter/Exit a Trade
Recommended further readings
- Getting Started in Chart Patterns. Bulkowski TN. John Wiley & Sons; 2006 Feb 1.
- Persistence, Performance and Prices in Foreign Exchange Markets. Ramadorai, T. (2006).