

Understanding Simple Corrections
Corrective waves are either simple or complex, the only difference between them being that complex corrections involve at least an x-wave or an intervening x-wave. If a corrective wave is a simple one, there are only three possibilities that the market can form. Elliott found that when corrected, the market forms either a zigzag, a flat or a triangle. If the overall correction is considered to be a simple one, then by the time it is completed, a new move of the same degree or higher will have started. On the other hand, if it is a complex correction, an x-wave will follow. In both cases, though (whether a simple or a complex correction), traders will have to deal with the same patterns: a zigzag, a flat or a triangle.
| Broker | Bonus | More |
|---|
How to Trade Simple Corrective Waves
Simple corrections are not that common! This is mandatory for a trader to understand before even labelling a move. However, corrective waves are common, so if anything, the move intended to be counted will most likely be a complex correction. This doesn’t even matter when it comes to how exactly to trade such patterns. The reason for this is that even if the market forms a complex correction, the first part of that correction will be a simple flat or a zigzag, so the rules for trading these patterns are basically the same.
How to Trade a Zigzag
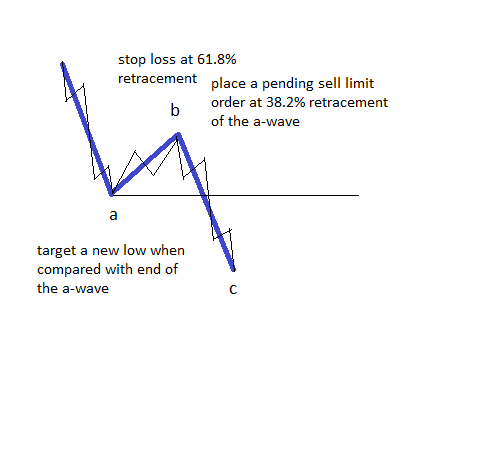
Zigzags are simple corrective waves, also called three-wave structures. Their labeling is a–b–c, and the structure is 5–3–5. This means a five-wave structure for the a- and c-waves, and a three-wave structure for the b-wave. Moreover, it means impulsive waves for waves a and c, and a corrective structure for the b-wave. As mentioned on one of our previous articles here on our Forex Trading Academy project, the key to interpreting a zigzag is to look at the retracement level for the b-wave. It is mandatory for the retracement level to be less than 61.8%, and this gives us the trading tools necessary to find the right entry, stop loss and target when trading the zigzag. The idea is to place a pending order, or to enter the market at the time the price retraces more than 38.2% of the a-wave. This means basically that we’re trading the retracement level of the b-wave. Such an entry can also be split into multiple entries as well. For example, if one wants to trade one lot, it is wise to sell (in a bearish zigzag) half of it at the 23.6% level and the rest at the 38.2%. After all, the b-wave in a zigzag must mandatorily retrace a minimum of 1% of the a-wave, and waiting for the 38.2% might end up in missing the impulsive wave to follow. A conservative target for the trade should be a new low below (in a bearish zigzag) the end of the a-wave, as this is mandatory in a zigzag. This target should be used, though, only if the retracement level of the b-wave is more than 38.2%, and into the 50% area of the a-wave. Otherwise, it makes no sense to trade it for this target, as the reward is simply too small. Aggressive traders, on the other hand, can go for a move equal to the length of the a-wave, as this is what happens most of the time in a zigzag pattern.
How to Trade a Flat
 Trading a flat is not as straightforward as a zigzag is, in the sense that one cannot predict the end of the b-wave. All we know is that the b-wave should retrace a minimum of 61.8% into the territory of the previous a-wave, but there is no limitation on the retracement level. Based on the type of the flat pattern the market forms, we can have a retracement of more than 80%, 100%, or even more than 161.8% when compared with the length of the previous a-wave. As a result, we’re not able to set a proper stop loss for the entry, as it’s not possible to estimate the end of the b-wave.
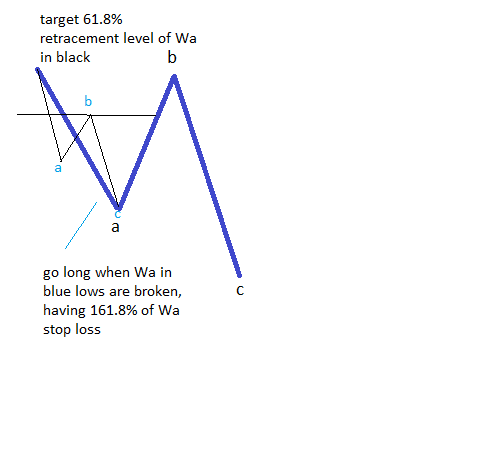
What do you do in such a case? The answer comes from trading a flat differently from a zigzag. A flat pattern has an a–b–c structure, and the a and b-waves are corrective in their nature. Because it is mandatory for the b-wave to retrace more than 61.8% of the previous a-wave, and the a-wave is a corrective wave, we can trade the b-wave based on the structure of the a-wave. Being a corrective wave in its own right, the a-wave can either be a zigzag or a flat of a lower degree. The idea is to wait for the a-wave to almost complete, and then to fade the move with a trade in the opposite direction. In this case, the take profit should be placed at the 61.8% retracement level of the whole a-wave, or a trader can trail this stop moving forward. In this way, an even more aggressive retracement level can be traded. The correct entry should be when the c-wave of a lower degree completely retraces the previous a-wave, in which case the stop loss should be 161.8% of the a-wave, projected from the end of the b-wave. Rarely the c-wave goes above 161.8%, and this is the reason for the stop loss.
How to Trade a Triangle
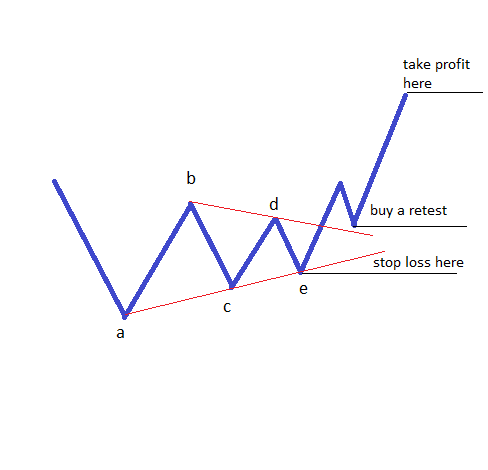 Triangles are the most common corrective waves by far. If a consolidation (not to be mistaken for a correction!) is about to form, it will most likely be a triangle. Moreover, a triangle will most likely be part of a complex correction, and since complex corrections are really common, then triangles are really common as well. Triangles are most likely to be contracting ones, and this gives us the way to trade them. Any triangle is a three-wave structure, even though the actual pattern has five different legs: a–b–c–d–e. The idea behind it is that each leg is a corrective one, or a three-wave structure of a lower degree, and this is why the whole pattern is considered to be corrective as well. The key to trading triangles is to look at the moment the b–d trendline is broken. Most of the time such a break comes with a retest of the b–d trendline, and this is the moment a trade can be taken, with a stop loss at the end of the triangle. A normal take profit can be the length of the longest leg of the triangle projected from the break of the b–d trendline. This is considered to be a conservative approach, though, as the price often simply explodes after the triangle is broken.
These three approaches to trading simple corrections show the simplicity of the Elliott Waves theory, and how the logical approach limits the possibilities for the next pattern to form. It is said that the simple things work best, and when it comes to trading, simple corrections with Elliott Waves do work wonderfully, as long as the proper stop loss and take profit levels are used.
Other educational materials
- Types of Expanding Triangles
- Trading with X Waves
- The Concept of a Running Correction
- Double Three Running Patterns
- Double and Triple Running Flat – The Most Powerful Corrective Pattern
- The Waterfall Effect – Using Fibonacci to Find Targets
Recommended further readings
- Predictability of the simple technical trading rules: An out-of-sample test. Review of Financial Economics Fang, J., Jacobsen, B., & Qin, Y. (2014). , 23(1), 30-45.