

Important Gann Trading Methods
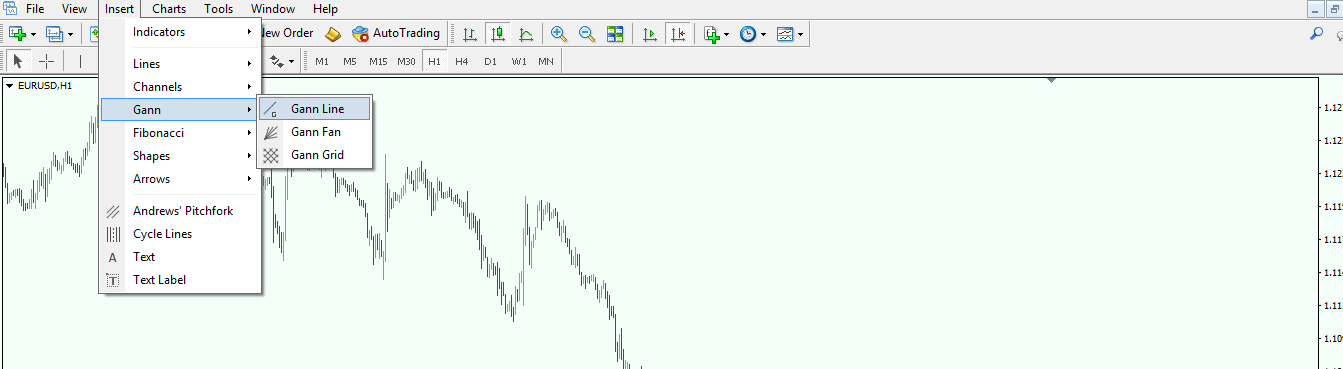
W.D. Gann was one of the most famous traders of all time, and was heavily involved in trading the commodity and stock markets. To this day there is a mystery regarding the trading methods he used for forecasting future price movements, but his legacy to the technical analysis sector is huge. All trading platforms offer Gann tools, and the most popular platform, the MetaTrader, has a special tab on the platform called simply “Gann”. Under this tab, there are three tools that a trader can use: Gann Line, Gan Fan, and Gan Grid.
The idea of this article is to explain how to use these three trading tools, and what other things we need to consider when trading Forex markets with the Gann system. It is important to note that Gann was a strong believer in the time element attached to a forecast.
| Broker | Bonus | More |
|---|
Interpreting the Gann Trading Tools
According to Gann, every financial product has its own way of moving, and he introduced the concept of the 1 x 1 line. This means that a specific angle must repeat on and on for that financial product, and the angle is different for rising and falling markets. The reason for the angle being different comes from the fact that market psychology plays an important role. In rising trends, there is a strong tendency for complacency, while in falling trends, market participants panic. As a result, a bearish market will always have a steeper angle, hence a steeper 1×1 line than a rising one. When it comes to the Forex market, it means that each currency pair has its own way of moving to the upside and to the downside. This is only normal because a currency pair reflects the economic differences between the two currencies that form the pair.
The Gann Line and Grid
The first Gann indicator offered by the Metatrader is the Gann line, which, in fact, represents the 1×1 line. The idea behind the Gann line is to use it to draw channels (by connecting tops and bottoms), and to time the break of such a channel with the Gann tool. However, the MetaTrader does a poor job in showing the importance of this tool, and it cannot be properly used with the MetaTrader settings. With these settings, it looks like a normal trendline, and it has no use whatsoever other than showing potential support or resistance levels. Applying the Gann Grid indicator on a chart will result in the screen being filled with multiple squares, equal in size, the idea behind it being that future resistance and support levels can be found based on these squares. Unfortunately the indicator will result in crowding the screen, leaving little space for another technical analysis tool.
Gann Fan
Of all the Gann tools offered by the MetaTrader, this one is by far the most important, and best represents Gann’s interpretation of markets. The Gann Fan is to be found under the same Gann tab. The idea behind the Gann Fan is to use it after a top or a bottom is in place, to find out the angle of the new move, plus important support and resistance levels moving forward. The line in the middle is the 1 x 1 line, which represents the angle of that respective currency pair. The other lines should be interpreted in pairs: The first ones are the 1 x 2, the next ones are 1 x 4, and so on, and they provide support and resistance levels. The chart below shows the recent EUR/USD move lower, and the break lower comes from the moment the 1.12 area was cleared. If we apply the Gann Fan tool from that point, it shows us the angle of the whole-move price resistance levels that the price met during the fall. These resistance levels were given by the 1 x 2, 1 x 4 and 1 x 8 lines – the ones that are above the 1×1, as the overall trend is a bearish one.
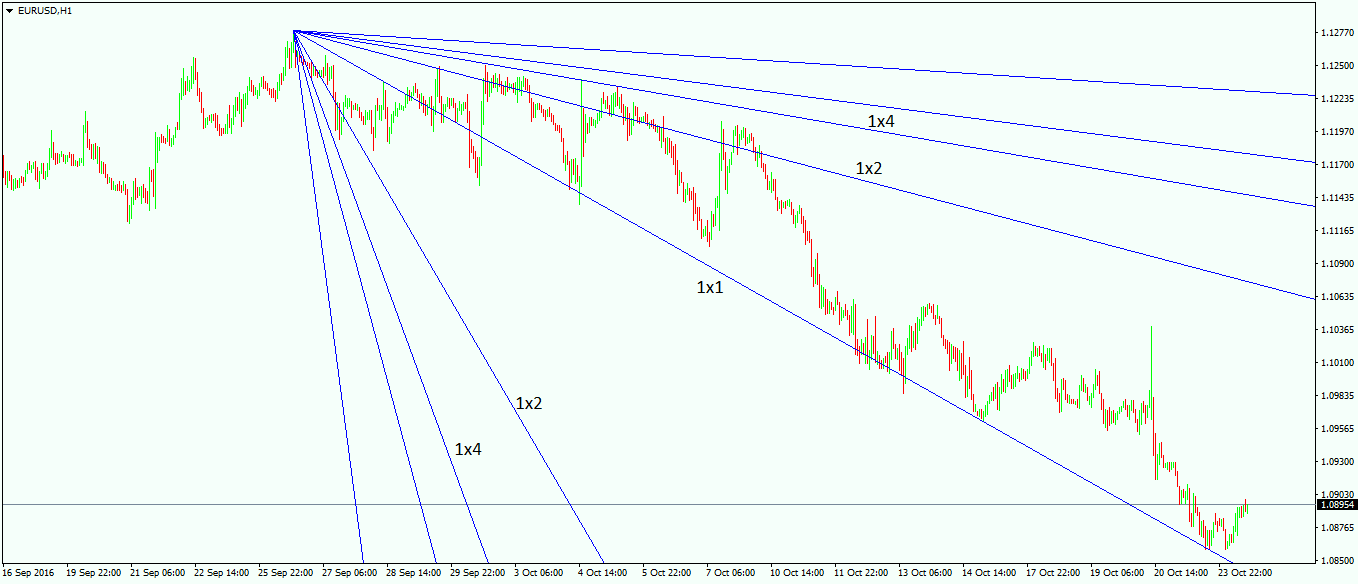
As you can see in the chart above, the more time passes, the more the lines diverge, in the sense that the angle between them is becoming bigger and bigger. This means that the support and resistance level is becoming more difficult to break moving forward. For example, if the price bounces from the current level all the way to the 1.1063 area where the 1 x 2 line currently is, it will be more difficult for the line to be broken, and a strong resistance should be met at that line. The usual caveat also applies when trading with the Gann Fan: The longer the timeframe, the stronger the support and resistance levels are. It is one thing to use the Gann Fan tool on the hourly chart, and a totally different thing to use it for the 4-hours or even longer time frames.
The Gann Fan tool is the most popular one among traders as it has the big advantage of being extremely visible. This means that support and resistance levels are there on the screen, and it is impossible to miss them. The next article here on the Forex Trading Academy deals with interpreting Andrew’s Pitchfork, and there is a reason for this sequence. This reason is the 1 x 1 line in the Gann Fan as, in this case, it acts like a magnet, attracting price. The same thing will apply in the case of the Pitchfork, only that the line is named differently, and the interpretation is a bit different as well. Besides these Gann tools offered by the MetaTrader trading platform, there are other studies that make the Gann system complete. These refer to the Gann Square, a tool that uses astrology and numerology to identify a reversal in the markets. However, so far it cannot be proved that these theories have the ability to influence markets, and this is one reason why not all trading platforms offer the Square within their default settings. The indicator can be uploaded, though, as a custom one, as explained in the article dedicated to the MetaTrader platform.
Other educational materials