

Understanding the Gartley Pattern
The Gartley trading pattern is famous in the technical analysis field because it reflects exactly the underlying psychology of greed and fear in markets. The name of the pattern comes from a famous technical analyst, H.M. Gartley, and the overall concept is quite simple and easy to understand and use. It is not by chance that this article follows the Elliott Wave section in our Forex Trading Academy project. The reason for this is that trading the Gartley pattern has much to do with Elliott, as we’re talking about different segments of a move, retracement levels, etc. Gartley, like Elliott, used letters to signal the end of a specific move, and the whole Gartley pattern uses only five letters: X, A, B, C, and D. The X represent the start of the pattern, while the D point is the end of it. Over time, multiple interpretations of Gartley’s work have appeared, but they have turned out to be just variations of the same thing. Below, the most important aspects of how to trade with the Gartley pattern are revealed.
| Broker | Bonus | More |
|---|
Trading with Gartley
According to Gartley, markets move in locked steps, and therefore specific patterns can be identified from time to time. The idea is to develop a trading system with a good enough risk/reward ratio that will make sure the trader becomes profitable following the system. The Fibonacci ratios that govern the overall Elliott Waves principle are to be found in the Gartley pattern as well. By comparing the Gann pattern with the Elliott Waves theory, it is clear that the Gartley pattern is only suitable for trading corrective waves, and not impulsive moves.
The Basic Gartley Pattern Explained
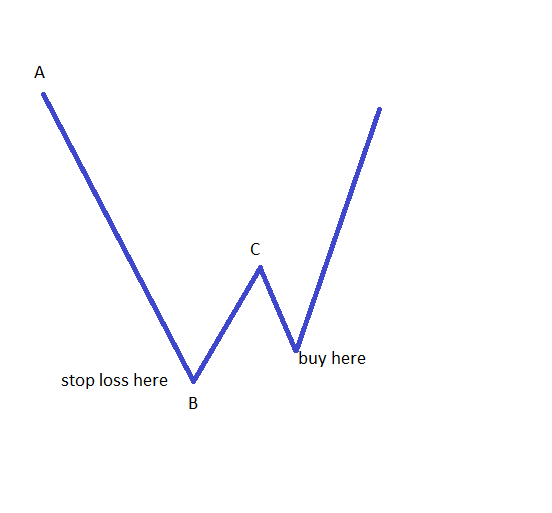 The Gartley pattern consists of identifying a significant bullish or bearish trend/segment and labelling it with A–B, where A represents the start of the move and B the end of it. It is vital that the A–B trend has minor rallies (in a bearish trend) or dips (in a bullish trend). After the completion of the A–B segment, the market finally makes a countermove, labelled with the letter C. The B–C segment is therefore moving in the opposite direction to the previous A–B trend. This B–C segment must be stronger than the opposite moves in the previous A–B trend, and this is how we know the A–B trend is completed.
The overall idea is that the market will not turn and move beyond the end of B, and traders need to identify a suitable place to trade such a scenario. According to Gartley, a retracement of approximately 50% of the whole B–C segment is needed before taking a trade with an open target and a stop loss at the end of the B level.
Variations of the Gartley Pattern Used Today
While the above scenario represents the original Gartley pattern, it is not very useful in trading Forex markets today, as these markets are characterised by 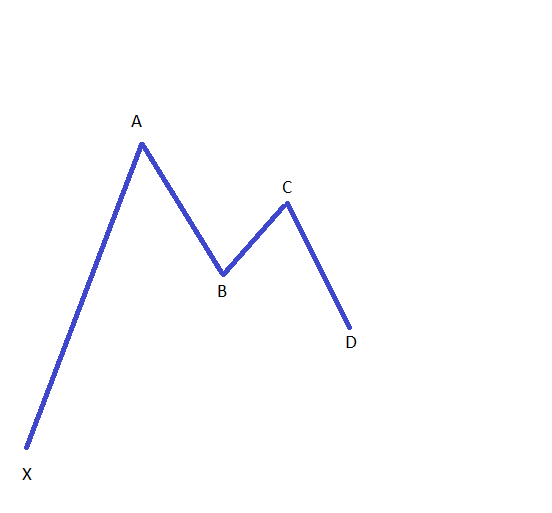 sharp and quick moves, followed by ample retracements. To survive in such a trading environment, traders need an exact plan, based on specific entry and exit levels, risk/reward ratios, etc. This can be done using the original Gartley pattern and adapting it to fit the day-to-day trader’s needs.
There is also a mathematical formula that can be used to set the take profit in a Gartley pattern, based on the levels of the five points that make the pattern. In this case, the initial strong trend that is needed in a Gartley pattern is no longer labelled as A–B, but as X–A. In this way, the X point is the beginning of the Gartley pattern, while the A point is the end of the trend. In this modern interpretation, Gartley is being used to find the end of a correction, and therefore to trade in the opposite direction. The end of the whole correction, and of the Gartley pattern, is the D-point. This D-point can be calculated using the following formula: D = B + C–A. This is valid if one wants to sell or go short by the time the Gartley pattern is completed. Usually, this is around the 61.8% retracement level of the whole original X–A strong trend.
Channelling with Gartley
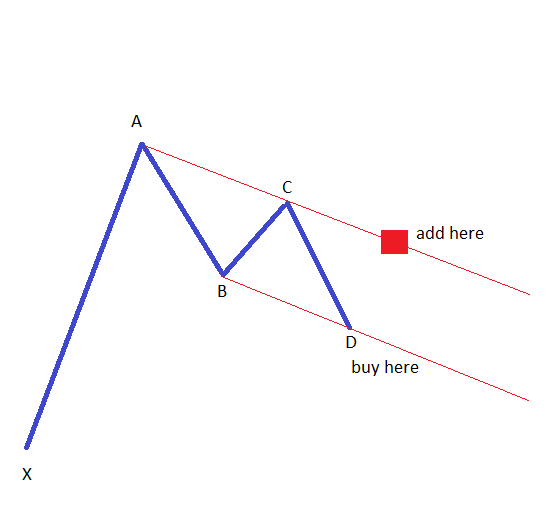 The Gartley pattern has a channelling component as well, in the sense that trades can be filtered if a specific channel holds or is being broken. The break in the channel represents a nice place to add to a trade, as it implies that the Gartley pattern was indeed a reversal one. Building such a channel is an easy task. All we need to do is to draw a trendline and connect the end of the A and C points. This trendline should then be copied and pasted on top of the B point. The resulting channel should, ideally, have the end of the D wave at the top of the channel in a bearish set-up, or the bottom of the channel in a bearish one.
The idea behind using a channel with the Gartley pattern is to see when the channel is broken and to add to the original trade. A channel has the advantage of being a visible pattern that leaves little room for interpretation, and a break in it clearly shows that the previous trend is completed.
As mentioned earlier, the Gartley and Elliott theories have many things in common, and interpreting corrective waves with the Elliott theory will, one way or another, lead to trading a Gartley pattern. The advantage of a Gartley pattern over Elliott is that it comes with discipline, whereas the Elliott theory is a relative one. Timeframes play an important role too when it comes to Gartley. A pattern traded on the weekly or daily charts is more powerful, and has different implications, than one that appears on the hourly chart. Considering that there are many currency pairs to be traded on the Forex market, and the fact these pairs can be analysed on multiple timeframes, the Gartley pattern should have many uses for the day-to-day Forex trader.
Other educational materials
- Trade with Risk-Reward Ratios
- Bullish or Bearish Setups Using Stars
- Explaining the Difference Between Engulfing and Piercing
- Hedging – What it is and How to Use Different Types of Hedging
- How to Trade with Gann
- How to Set Up an Expert Advisor
Recommended further readings
- Trade Chart Patterns Like The Pros. Duddella, S., 2007.
- “Harmonic Pattern Trading.” Duddella, Suri. Full Trading Circle: The Complete UndergroundTrader System For Timing & Profi ting in All Financial Markets: 235-250.
Related Articles