

Use Market Geometry to Profit from Forex
Market geometry is a concept that not many traders are familiar with. The reason for this is the fact that there are no specific rules that define market geometry, and the whole concept is based mostly on using previous behaviour to forecast future prices. In a way this resembles the Elliott Waves theory, which is based on previous patterns used to forecast future price action. However, while the Elliott theory has clear rules for counting the waves, market geometry is mostly based on estimations. There is some common ground with the Elliott Waves theory, though. We know by now that the Elliott Waves theory is based on impulsive and corrective waves. In contrast to that, market geometry can only be used in corrective waves, or when markets are consolidating, or ranging.
| Broker | Bonus | More |
|---|
Market Geometry with Ranges
As mentioned earlier, the first thing to do is to find a range, and for that, some sort of previous consolidation is needed before we can talk about market geometry. The next step is to look for swings around a specific point in the chart, and that is the basis of the whole concept. To exemplify this, we’ll use the same EUR/USD daily chart as we used in the previous articles, as it offers a beautiful range in the last year and a half that allows us to demonstrate market geometry principles.
Using Amplitude to Find Out Future Prices
The starting point for any market geometry analysis should be the beginning of the consolidation area. In the case of the EUR/USD daily chart , this is the moment the price hesitated after it dropped almost 4,000 pips.
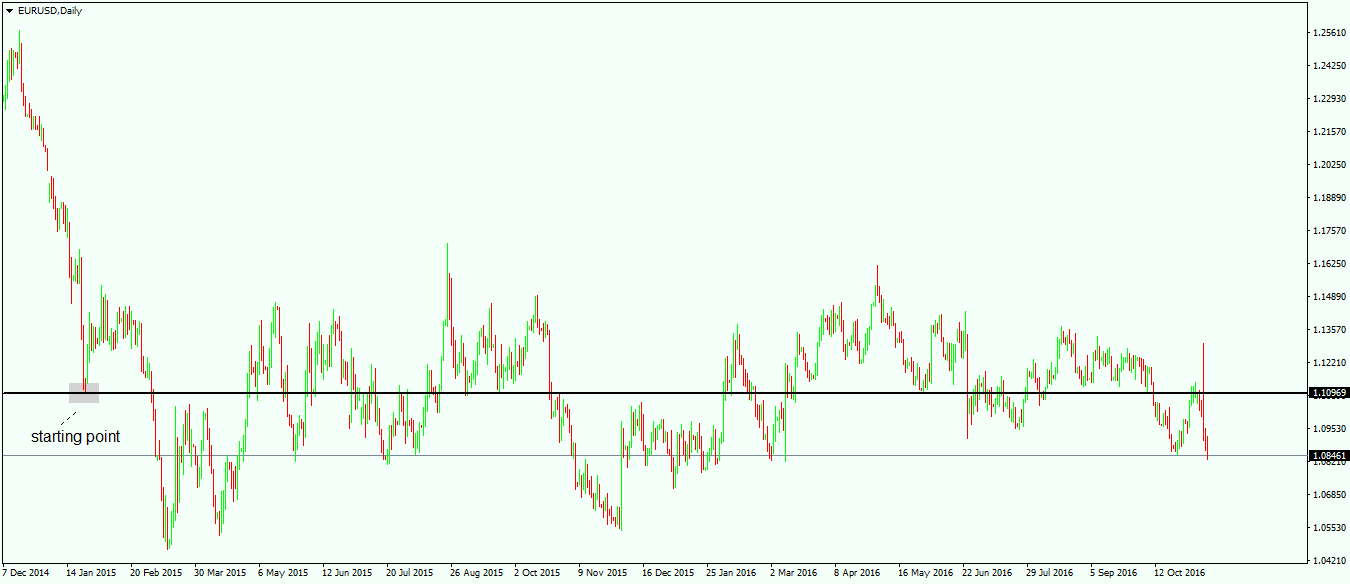
From the starting point, the next thing to do is to draw a horizontal line. This line is going to be the decisive line for the whole market geometry analysis from this moment on. The next thing to do is to measure the amplitude of the highest or the lowest point when compared with the starting-point value. In our example, the lowest point has the furthest distance from the line, and that is the amplitude we will use.
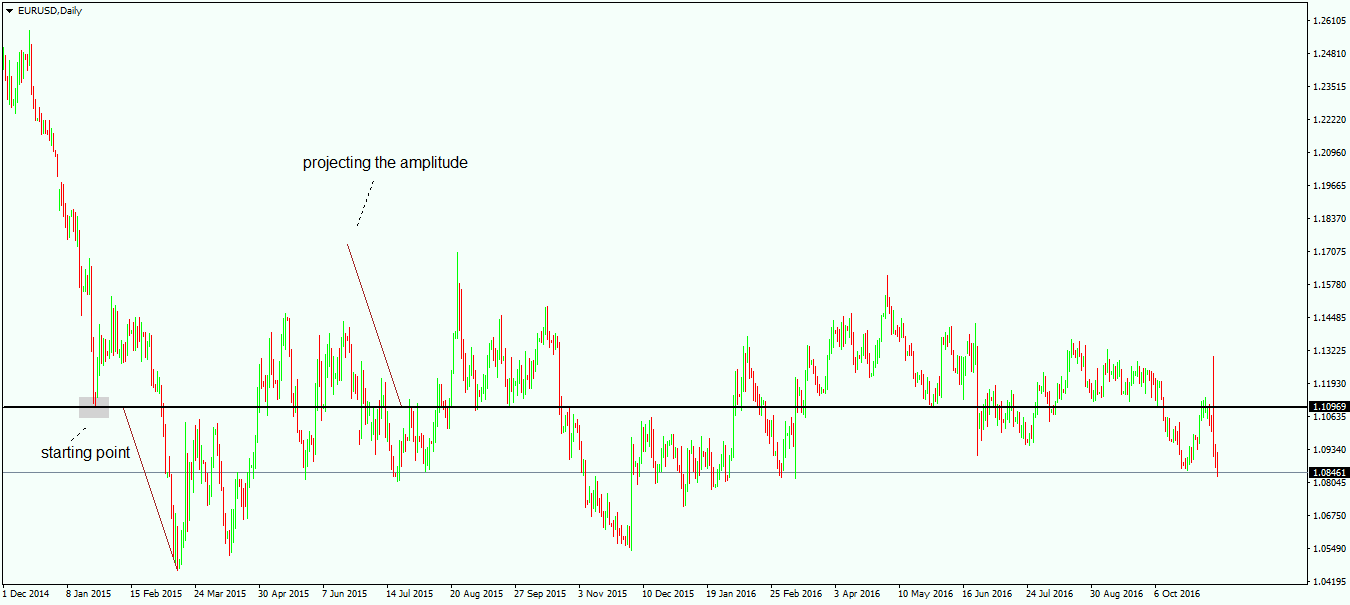
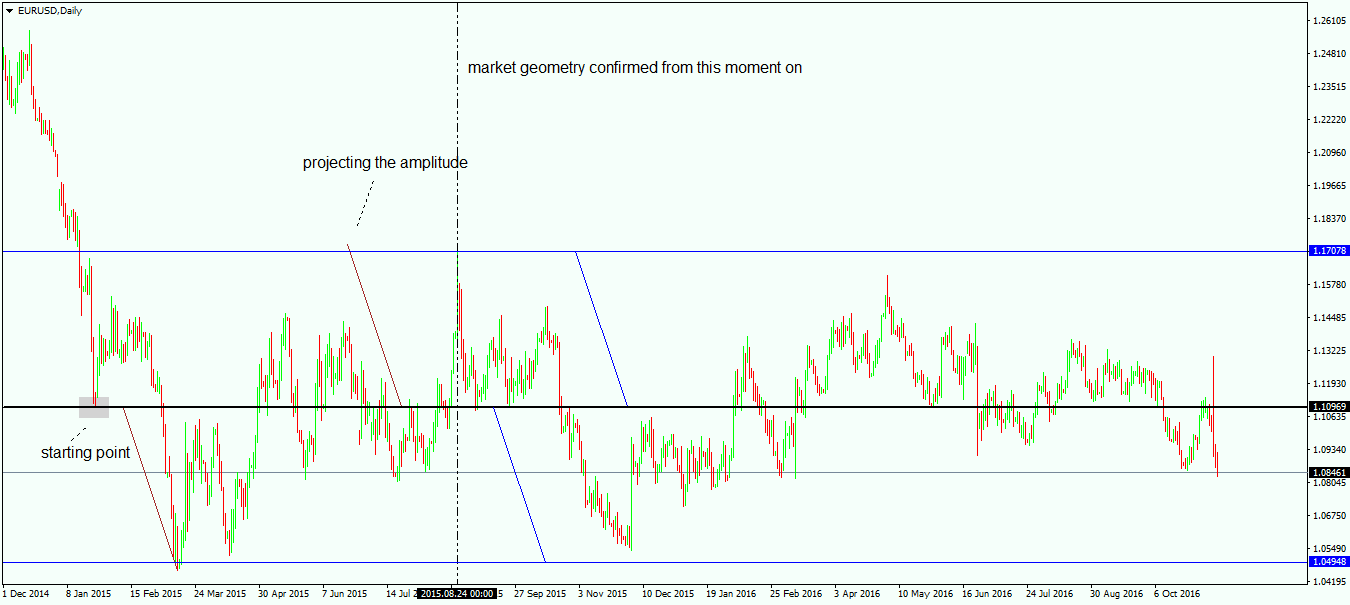
Projecting that amplitude from the starting point gives us an educated guess as to what the opposite swing may look like from a market geometry perspective. 149 days later, the market jumps almost to that area. Now that we have a confirmation of our market geometry starting point and amplitude, we can start to build the inner levels that will define the whole range and trading from this moment on. Keep in mind that what follows is valid only after the amplitude is confirmed, and refers to the price action to follow.
Building the Market Geometry Set-up
After the amplitude has confirmed the starting point, it is time to build the market geometry set-up from that moment on. This means that from that vertical line that you can see on the chart above, we can set up some nice trading set-ups. To do this, the following steps are necessary:
- Measure the distance from the spike that confirmed the amplitude to the starting point, and project it to the downside from the starting point. The result will be a channel divided into two different parts, with the starting point value being the pivotal one. If the price is on the upper side of the channel, the bias is bearish, as the market will be attracted by the starting point level or the pivotal one. The same is valid when the price is on the lower side of the channel, only that the bias is a bullish one.

- Use the Fibonacci retracement tool to find the 38.2%, 50% and 61.8% levels on both channels. These are the entry points for both long and short trades, depending on where price is: on the upper or the lower channel. The idea behind the market geometry trading set-up is to short the 38.2%, 50% and 61.8% levels while the price is on the upper side of the channel, with the take profit at the pivotal level. When the price is on the lower side of the channel, buying the Fibonacci levels with take profit at the pivotal level is the right thing to do.
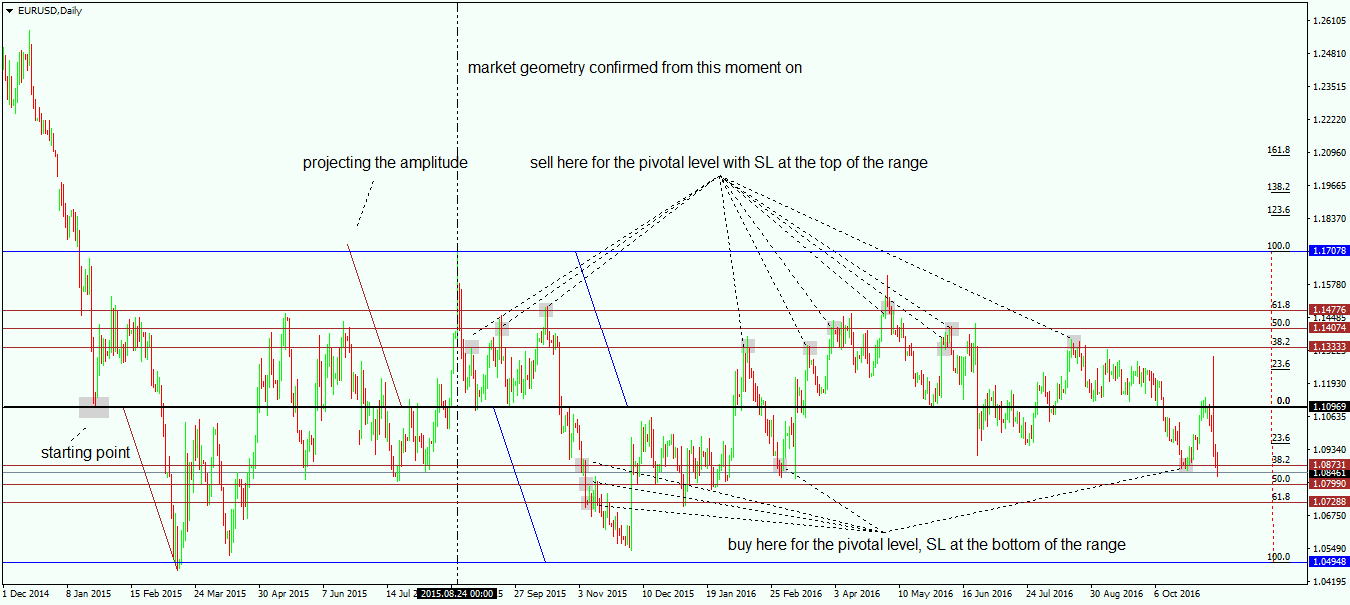
This simple approach results in tremendous profitability over the period to follow, as the range is still holding to this day. There are no less than ten shorts and four longs that have been traded in the meantime, all of them hitting the take profit for more than 3,300 pips profit (three thousand three hundred!!!). The stop loss for each trade should be the blue line, or the top/bottom of the range. Once the stop loss is reached for any one trade, the whole market geometry set-up is completed. While the risk/reward ratio is not impressive, the fact that the range lasted so long is what matters from a profitability point of view. As a rule of thumb, the longer the range holds, the more profitable the market geometry set-up is, as trades will obviously keep hitting the take profit. In the end, the range is going to be broken and the stop loss hit, but from this moment on it doesn’t matter any more, as it is not possible for the loss to be bigger than the profits already booked.
While the approach looks to be a simplistic one, the whole market geometry concept should not be considered a simple one to use. Overall market profitability is the ultimate goal when trading financial markets, and it is not that easy to be attain. The idea is not to be profitable on one trade or one set-up, but to be able to be, and stay, profitable in the long run. Trading goes like life, with its ups and downs, but what matters is for the account to grow. It is not possible to have only winning trades, as taking losses is part of the job. there will be more on market psychology and its implications for overall trading profitability to follow in other articles here on the Forex Trading Academy. For now, keep in mind that market geometry, while not having concrete rules, is one of the things that keeps a trader disciplined and focused on technical levels rather than market fundamentals.
Other educational materials
- How to Draw a Trendline
- Pennants as Continuation Patterns
- Price and Time – The Holy Grail in Trading
- Japanese Exchange Group (JPX)
- LSE – London Stock Exchange
- NASDAQ
Recommended further readings
- Evolving chart pattern sensitive neural network based Forex trading agents. Sher, G.I., 2011. arXiv preprint arXiv:1111.5892.
- “The string prediction models as invariants of time series in the Forex market.” Pincak, Richard. Physica A: Statistical Mechanics and its Applications 392, no. 24 (2013): 6414-6426.