Moving averages are extremely popular among traders as they represent one of the most-used trend indicators available. The cause of their popularity comes from the fact that they are simple to use and interpret, and yet the signals generated are strong enough to allow traders to profit from market swings. Traders use moving averages for multiple reasons, but the most important use of this indicator is to help find support and resistance areas, or areas where a trader might want to add another trade in a trending environment. Riding a trend doesn’t only mean staying in the trend for the whole period, but also adding to the initial position when the market retraces. This is what moving averages are for. Trading with moving averages is very simple, yet the implications are so powerful that traders look very carefully when the price meets a higher average for the first time, as most likely it is going to be rejected from it. Because of this, there are a variety of trading strategies developed around moving averages, and how the price reacts when it reaches them.
Moving Averages Generalities
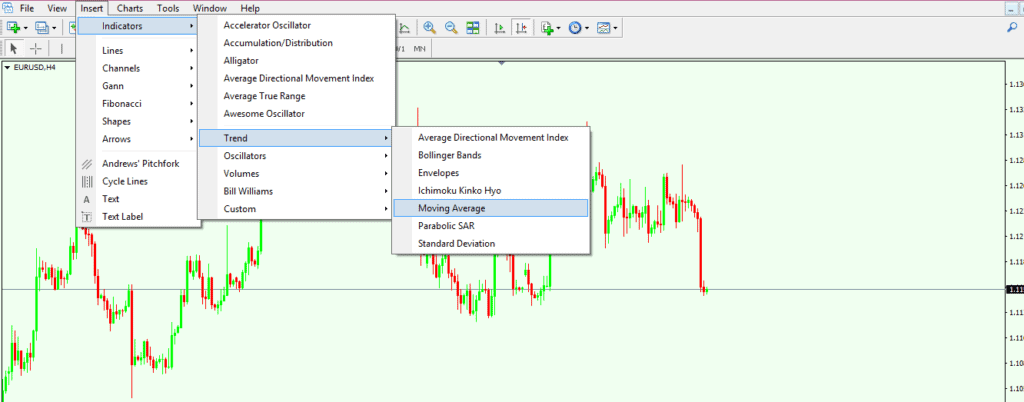
Moving averages are of multiple types, but the ones to be used are Simple Moving Averages (SMAs) or Exponential Moving Averages (EMAs). Of the two, the SMA is a fixed one, in the sense that by the time a value is plotted on a chart it is going to stay there forever, while the EMA adapts to future price levels. From this point of view, the SMA is more reliable. As a rule of thumb for any indicator, no matter whether it is a trending one or an oscillator, the longer the timeframe it is attached to, the more important is its interpretation. For example, it is one thing for the price to meet a moving average on the hourly chart, and a totally different thing if the same thing happens on a monthly or weekly chart. The support/resistance levels on the longer timeframes are far more important than those on the hourly ones. Moving averages are offered by any trading platform, and here we’ll use the MetaTrader 4 to show where the indicator is to be found, and how to apply it on a chart. Simply open the MetaTrader 4 trading platform, and the Moving Average indicator can be found under the Insert/Indicators/Trend tab.
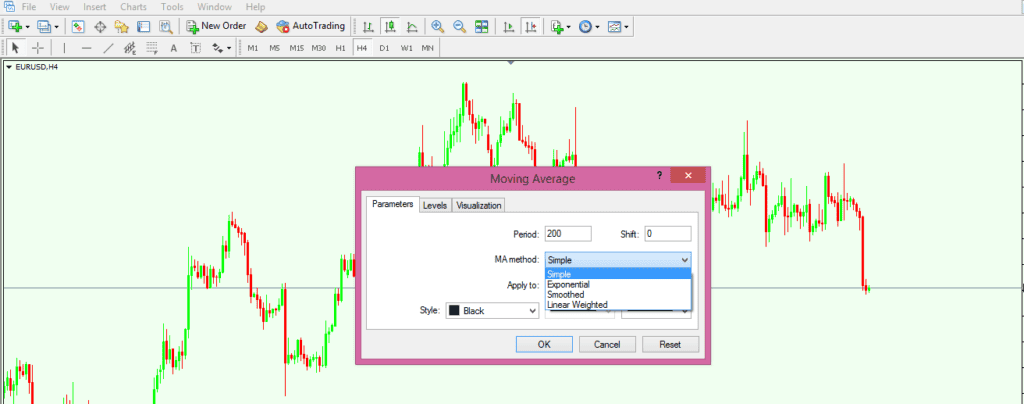
By clicking on it, a pop-up window appears, and in that window we have the possibility of customising our indicator. More exactly, we can choose the period it is going to take into consideration, as well as other things such as simple or exponential, or another type of moving average we want, the colour or it, its appearance, etc. The longer the period over which a moving average is taken into consideration, the more difficult it is for the price to break.
Trading with Moving Averages
As the title of this article suggests, the main idea of using moving averages is to identify support and resistance levels that the price may meet. Once such areas are found, a new trade in the general direction of the trade can be taken. However, there is another way to use these averages, and this is to split the market into a bullish and a bearish one. Based on the timeframes over which the moving averages are applied, the implications for future price action are very important from both a short-to-medium term perspective as well as from a long-term one.
Golden and Death Crosses
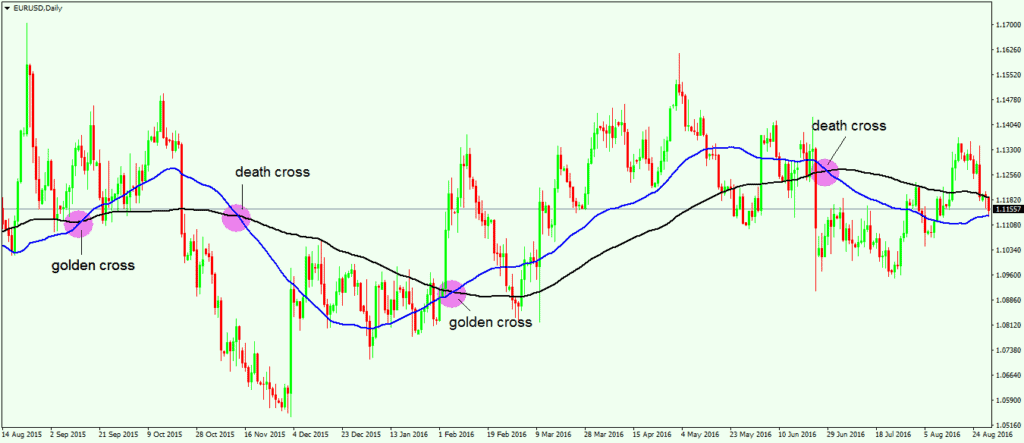
The most popular and simplistic way to use moving averages is to divide the market into a bullish or a bearish one based on a cross. Even today, financial newspapers refer to these crosses as being really important and defining for a market. In order to look for a golden or a death cross, a daily timeframe needs to be open on the financial product one is interested in trading. In our case, let’s use the daily chart on the EUR/USD pair. The next thing to do is to apply two different moving averages on the chart: one that takes into account 100 as a period (MA100), and one that considers 50 as a period (MA50). This means that MA100 is plotting a value based on the values of the last 100 days, while the MA50 one is taking into account only the last 50 days.
The overall idea to interpret a market is quite simple: When the MA50 moves above the MA100, or it makes a cross, this cross is called a golden cross. It means that from that moment on the overall market turned bullish, and so buyers should dominate that market. The opposite is true as well: When the MA50 crosses the MA100 to the downside, the cross that is formed is called a death cross, and signals a bearish environment in the period ahead. The EUR/USD chart below shows both golden and death crosses, as the MA50 (the blue line) crosses above or below the MA100 (the black one).
Finding Support and Resistance Levels in Trending Markets

Another way to use moving averages is to apply multiple ones on a chart in order to spot trend reversals, or to add a position in a trend that has already started. In doing that, the moving averages to be used are the MA20, MA50, MA100, and MA200. Below is the 4-hour chart on the EUR/USD pair with all four moving averages plotted. The MA50 and MA100 have the same colour as in the previous example, while MA200 and MA20 are represented in brown and magenta respectively.
The idea behind this strategy is to wait until all those four moving averages are aligning in the so-called perfect order (20, 50, 100 and 200), and then to trade in the direction of the overall trend when the price moves into the 50, 100 or the 200 MA, while the MA20 is not crossing above or below the MA50. The moment that this happens, the support or resistance levels are not supposed to be used anymore. As mentioned at the start of this article, moving averages are a simple yet very effective way to look at markets. Traders should use them with confidence, as the underlying price is always more important than the fundamental news that causes a spike or a dip to happen.
Other educational materials
- How to Use Parabolic SAR to Buy Dips or Sell Spikes
- Bollinger Bands – Profit from One of the Best Trend Indicators
- Trading with the Cloud – Use Ichimoku Cloud to Spot Reversals
- Trading Sessions and Their Importance
- Fundamental Analysis – What It Is and How to Use It
- Technical Analysis – What to Consider
Recommended further readings
- Study Guide for Technical Analysis Explained. Pring, Martin J. McGraw-Hill, 2002.
- “Technical analysis in the foreign exchange market: a layman’s guide.” Neely, Christopher J. Review 79 (1997).
Related Articles