A wedge falls into the same category as the head and shoulders pattern: It is a reversal pattern, which means it forms at the end of either a bullish trend or a bearish one. A wedge that forms at the end of a bullish trend is called a rising wedge. This is because its head is rising, as the overall price action within the wedge pattern is a bullish one. On the other hand, a wedge that forms at the end of a bearish trend is called a falling wedge. As a rule of thumb, a rising wedge is a bearish reversal pattern, while a falling wedge is a bullish pattern. Wedges form more often than head and shoulders patterns, but this doesn’t mean they are not effective. As a matter of fact, if I were to compare the two reversal patterns, I would value a wedge over a head and shoulders pattern. This is because they take less time to form, and because they can form even if there’s no previous strong trend before the pattern. More on this a bit later in this educational article.
What Makes a Wedge?
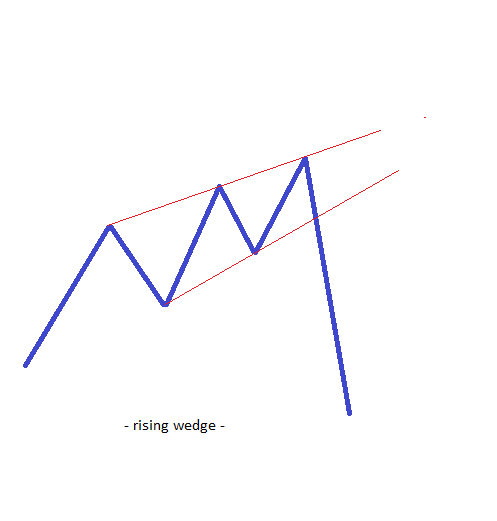
The image above shows a typical wedge, and what such a pattern looks like. After a bullish trend, the price makes marginal highs, only for the market to aggressively move lower after the wedge is broken. The same is valid after a bearish trend: The market moves higher after the wedge is broken and, in a way, the wedge resembles a triangular formation. The only difference between a wedge and a triangle is the fact that a triangle usually forms on the horizontal, while a wedge does not. It is said that a rising wedge falls and a falling wedge rises, and this tells much about the price action to be expected after such patterns form. Trading a wedge is straightforward and leaves little room for different interpretations, as can be seen below.
Wedges with Elliott Waves Theory
The most representative part of the Forex Trading Academy project is the one dedicated to the Elliott Waves theory. Under this theory, the market moving in corrective and impulsive waves, and the theory is based on counting these waves. As a convention, impulsive waves are labelled with numbers, and corrective waves with letters. Even if a wedge has all its segments as corrective waves, it should be labelled with numbers. Elliotticians associate a wedge with an impulsive wave; although not a regular or a classical one, but rather a terminal one. Such an impulsive wave is always completely retraced, and it has no more and no less than five segments: that is, five waves.
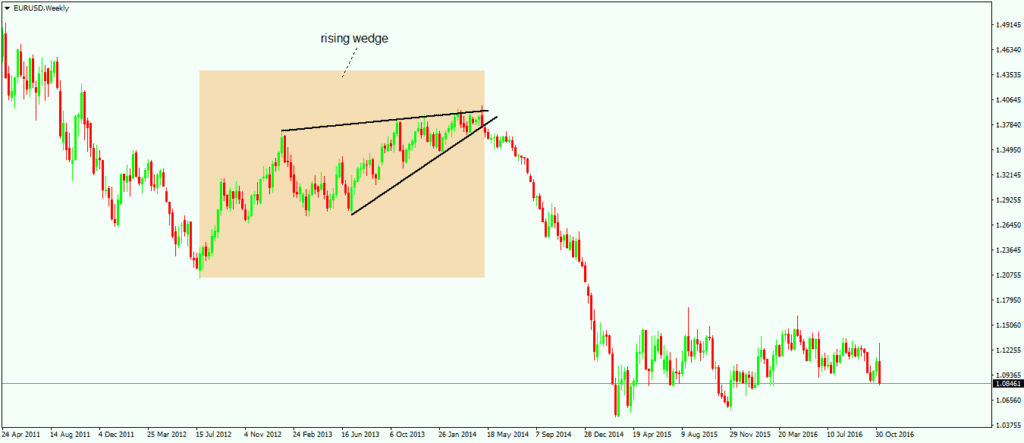
The chart above shows the EUR/USD weekly timeframe with a beautiful rising wedge pattern forming there. As the name suggests, the pattern should be a bearish one, as can be seen by the price action that follows. Based on the Elliott Waves theory, the wedge should be labelled with numbers, even though all the waves are corrective in nature. Any wedge must have a five-wave structure.

The chart above shows the five-wave structure of the rising wedge, and Elliott Waves traders are looking for the 1–3 trendline to be broken. Any wedge travels between the 1–3 and the 2–4 trend lines, and the general assumption is that it is mandatory for the 1–3 trendline to be pierced. While this happens in this case, it should be noted that it is not something that should be viewed as a rule. There are wedges that don’t pierce the 1–3 trendline, as the most important line is the 2–4 one. This means that all the focus should be on drawing the 2–4 trendline and watching for it to break. Such a break implies that the whole pattern is completed and that the market has started the next wave.
Retesting the 2–4 TrendLine
Usually, the 2–4 trendline is retested after its break, but this is not mandatory. The example above shows the EUR/USD not doing that, and trading for the 2–4 trendline to be retested will result in great losses. As a rule, traders should only look for wedges breaking higher/lower, depending on their nature, and that should be enough to mark the end of the previous trend. If the wedge is forming at the top or bottom of a trend, the break lower/higher should be significant. However, if the wedge is not forming at the top/bottom of a trend, it means a triangular formation is just ending. The break lower/higher should be even more powerful, especially if the wedge is forming on the longer timeframes.
Other educational materials
- How to Use Parabolic SAR to Buy Dips or Sell Spikes
- Bollinger Bands – Profit from One of the Best Trend Indicators
- How to Draw a Trendline
- Forex Market Terminology
- Profit from Forex Trading Using Different Trading Styles
- Pennants as Continuation Patterns
Recommended further readings
- “Trade policy and economic growth: a skeptic’s guide to the cross-national evidence.” Rodriguez, Francisco, and Dani Rodrik. In NBER Macroeconomics Annual 2000, Volume 15, pp. 261-338. MIT Press, 2001.
- “Can comparative advantage explain the growth of US trade?.” Cuñat, Alejandro, and Marco Maffezzoli. The Economic Journal 117, no. 520 (2007): 583-602.


