Price movements are the result of coordinated buying or selling at specific moments of time. It is said that if there are more buyers than sellers in a market, the market will rise; or, if there are more sellers than buyers, the market will move to the downside.
That is correct, but with one proviso: It depends very much on the quantity that it is being bought or sold. For example, it may happen that there are 100 buyers of half a lot each, and one seller of 100 full lots. The outcome will be that the market will move to the downside, not the upside, as the one seller actually trades a bigger volume that all the other 100 combined.
This brings us to the Volumes indicator on the Forex market, which is one indicator that deserves special attention. As you can see from the list below, MetaTrader 4 (and actually any other trading platform) under the Indicators list offers Volumes as being separate from the trend and oscillators indicators. It means that this is a special group of indicators that require special attention.
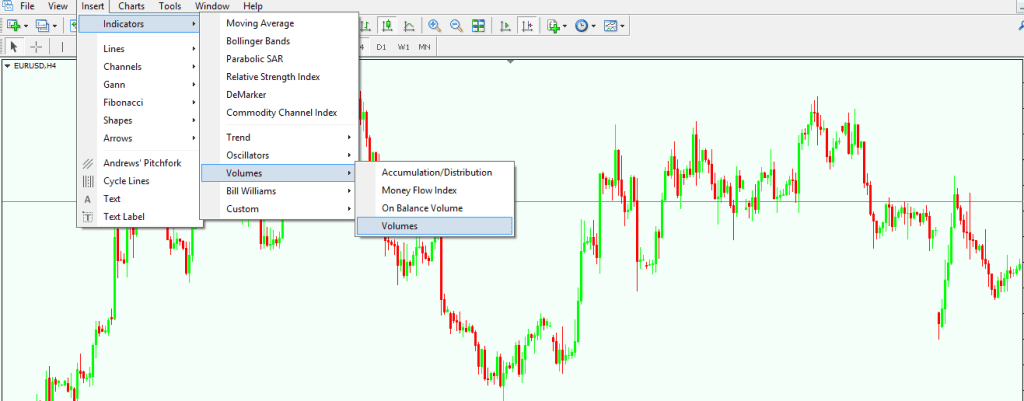
The MetaTrader 4 platform offers in its default settings no less than four indicators in this category, each and every one important in its own way. However, the Volumes indicator sums up very well what needs to the known about the indicators in this category.
Applying the indicator is as easy and straightforward as any other trend or oscillator, and it will be added to the lower part of the screen, below the actual price chart. As can be seen below, there are no additional settings to be made other than simply clicking OK. The colours can be changed, though, to any colour one wants, but since the green and red colours are implicitly associated with upwards and downwards moves, it is recommended to use them.

What is the Volumes Indicator?
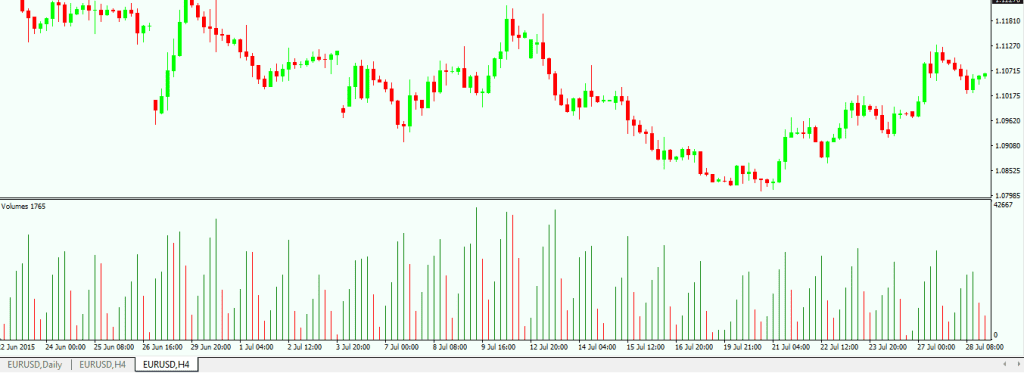
The Volumes indicator shows the traded volume for each and every candle in a given chart. This means that on a monthly chart, one candle shows the traded volume of that specific month; a weekly candle shows the weekly volume; and so on.
The bigger the volume is, the bigger the candle is, and vice versa: The smaller the volume that is traded, the smaller the candle. A big green candle suggests that there are mostly buyers on that volume, and so the market is expected to move to the upside. On the other hand, a tall green candle shows that more sellers dominated that candle, and the market is expected to move to the downside.
In other words, on a big green Volumes candle, one should look to go long, while a big red Volumes candle calls for a short position to be taken. What can be easier than trading Forex with the Volumes indicator?
The troubles come from the size of the Forex market. We’re talking about more than 5 trillion US dollars changing hands on each and every trading day, and that volume is not that easily represented on a chart by a simple indicator. This means that the Volumes indicator one can see on the MetaTrader 4 platform is actually only showing the volume of the broker who offers the trading platform
Such a thing is vital in interpreting the Volumes indicator, as it reflects almost perfectly the example from the start of this article: With one broker the Volumes indicator may show a green value for a specific candle, while on another broker it can show a red candle. If the situation is so confused, what is to be done? Can the Volumes indicator still be used?
Using the Volumes Indicator to Trade with the Crowd
Every trader knows that “The trend is your friend”, and this is true in the case of the Volumes indicator as well. In this case, the trend is given by the candles that show the biggest volumes when compared with the other ones, or the candles that stand out from the crowd. The colour of these candles shows the direction of the general trend, namely if we need to buy or sell. In order to filter all the Volumes candles, we need to do some historical research.

This means that we need to go back in time and see where the majority of the spikes are forming and at what levels, and consider those levels for further interpretation. In the example above, it can be seen that the 30,000 level is one that is not pierced or broken by many candles. As a consequence, the traded volume above that level is worth considering, and all eyes should be on the colour of the candle that closes above the 30,000 level. That colour will give the direction of the trade.
The way to trade with Volumes is to buy a green candle that closes about the 30,000 level in our example, or to sell a red candle that closes about that level as well. All the other candles in between, or candles that close below our 30,000 level should be ignored, as they do not represent a proper trading signal.
While the Volumes indicator is not representative of the whole Forex market, it shows the overall direction, and it is a nice approximation for the overall volume of the market. The real situation is rarely different, which is why Volumes is popular among Forex traders as well.
Other Markets in Which to Use Volumes as Entering/Exiting a Trade
While on the Forex market the Volumes indicator may seem like a relative one, in the sense that the signals generated are not viewed as 100% accurate, there are other markets where volumes, in general, are quite useful.
Such markets are the futures markets, or any other market where the traded volume can be seen for all the participants (individual stocks, for example), and traders have developed many trading theories as a consequence. One of the most popular is the Volume Spread Analysis (VSA) theory, but here is not the place to discuss it, since it cannot have a full application on the Forex market. Future projects may involve this theory, which is based on the full volume traded at one moment in time on an underlying security.
Other educational materials
- How to Use Parabolic SAR to Buy Dips or Sell Spikes
- Moving Averages – Find Support and Resistance Areas
- Bollinger Bands – Profit from One of the Best Trend Indicators
- Bill Williams – How to Use Williams Indicators When Trading Forex
- How Do I Make a Profit from Forex Trading?
- Forex Market Terminology
Recommended further readings
- Modeling movements in oil, gold, forex and market indices using search volume index and Twitter sentiments Tushar Rao, Saket Srivastava, IIIT-D, Delhi, India 2013
- Time-Frequency Analysis on Exchange Rate Indicators Tina Nemarnik, July 28, 2011


