

ブラジルレアル
Video Transcription: Steps to Make a Profit from Bullish and Bearish Engulfing Patterns
Hello guys, top rated forex brokers here, and we move forward with an interesting strategy to trade. Bullish and bearish engulfing. As you can see on the screen we deal with candlestick techniques and candles, therefore, one of the most powerful candlestick techniques is the engulfing pattern.
(0.21) Before anything you have to imagine this one relates to the stock market. It was invented on the stock market. On the FX market, it worked for years, it still works, but you have to be very careful with the time frame.
(0.39) Because now, the Spread, or the difference between the bid and the ask price, let me show this to you on the MetaTrader. The difference between the bid and ask price is so small that the conditions for an engulfing pattern are not there anymore. Look at the US Dollar and Swiss franc, 97520 to 97527 which is 0.7 Pips. Look at the euro-US dollar. It is 0.3 Pips.
(1.06) It is difficult to create an engulfing pattern on a bigger time frame, because if you look at the weekly chart; so let’s go to the weekly; this is the US dollar and Canadian dollar. Let’s go to the end of it and zoom in.
(1.25) With a bullish engulfing pattern or a Bearish one, you need to have a difference between the opening candle and the closing one in such a way that it will engulf the previous one.
The pattern looks like this. With a Bullish engulfing, (starts to draw) you have the body of a candle, let’s say that this is a candle, and let’s make it red so that we know it is a bearish candle.
(1.56) And then of course a red candle, with a shadow somewhere around here. Let’s make the body of it bigger like this, so this would be a red candle. then the next candle that comes, which is this green one, should totally engulf the red one like this.(green candle on screen)
(2.23) It doesn’t matter the length of the shadow, what’s important is the two bodies here (circles them). This one totally eats into the previous one. For a bullish engulfing pattern like this one, you need a Bearish trend. And then the market, of course, reverses into a Bullish tsunami. The same is valid the other way round.
(2.51) At the top, you have what? At the top, you have a strong Bullish candle followed by an even stronger bearish candle, but a candle that completely engulfs and eats into the previous one. What do we need for a candle to engulf the previous one? A gap.
(3.14) Because if this is the closing of the previous candle. And the opening price of the other one should be a bit higher to totally engulf this one, because if the opening price is here (top right of green candle), then it will not engulf this one.
(3.32) An engulfing pattern is typically a subject for the stock market. Because, when the stock market opens every day there is a gap and therefore the pattern works nicely.
(3.44) But it works on the FX market as well, let me show it to you right here on this US dollar Canadian chart. At the top the 1.46 which is on the weekly chart. The market closed or dies.
(4.00) At the opening, and this is the opening price of the new candle, and you look here at the OHLC, and closing price on the OHLC is 1.4533 and then on the new candle the opening price is 4601 which is 48 pips difference.
(4.30) So the market gets high at the opening of the new week, and closes lower on the trip; totally engulfs the previous candle. Now that is as bearish as bearish can be.
(4.42) This is called a Bearish engulfing pattern, and it shows the start of a new trend. There are two approaches to trade the Bearish engulfing or the Bullish one. To simply measure the length of the stronger candle, then to wait for a pullback.
(5.08) Ideally, you will see a pullback come into its territory about 50% 61.8% but that is not mandatory, and you might end up missing the whole point. Aggressive traders that don’t want to lose such an opportunity will go short at the closing of the second candle.
(5.31) And we will use any opportunity here to ebb on the same position. To know or to have an idea what this means for the overall reversal pattern, then the bigger the timeframe here, the more powerful the reversal will be.
(5.50) In this case, It’s a weekly chart, so if you zoom out and look at the market. So after the Bearish pattern here, imagine you go short here.
(5.59) Stop loss at the highs, even if it is on the weekly chart, the stop loss on the highs would invalidate the pattern, and you still have a risk-reward ratio of 1 to 2 or 1 to 3 for a US dollar pair, and that is quite something.
(6.20) From two simple candles, this is how Bullish and Bearish engulfing work. On the lower time frame it is very difficult, because rarely the market gaps on the hourly chart, for example, when the new candle opens, you have got to be careful with these patterns. Use them from the daily chart and the bar. These are beautiful patterns, so let’s move on to the next video.
日本のローソク足パターンを取り上げた前の2つの記事が1つのローソク足パターンを扱っていますが、これは3本のローソク足パターン、星(二ツ星、三ツ星)を扱っています。星は、トレンドの終了を正に形成される強力な反転パターンです。前のトレンドに属するグループにある最初のローソク足、同時ローソク足に似ている真ん中のローソク足、そして新たなトレンドがすでに始まっている同時ローソク足に続くローソク足で、3本のローソク足から星が形成されます。パターンが現れる場所に基づき2つの種類の星があり、その解釈は同じです。このパターン強力なので、強いトレンドを後で識別することができます。
反転パターンとしての星の種類
それはトレンドの終わりに現れるため、反転パターンとなり、強気あるいは弱気のパターンになりえます。強気の反転パターンは明けの明星と称され、弱気のパターンは宵の明星と称されます。
明けの明星の一般性
明けの明星のパターンはボトム反転パターンです。この名称の背後にあるアイディアは、それが日の出を示す水星のように高く上がってくることを示していることから来ています。明けの明星を形成する3本のローソク足があります。
- 大きい赤の本体のある強いローソク足
- 同時やトンカチのいずれかになりえる真ん中の小さなローソク足
- 緑の本体があるはずの反対の方向にある強いローソク足
上記の説明にありますが、日本のローソク足テクニックを重点的に扱った前の記事でここに説明したとおり、真ん中のローソク足はそれ自体反転のパターンです。トンカチや首つりパターンのトレーディングプランをセットアップする場合のように、そうしたパターンをトレードするのは正攻法です。ここにあるアイディアは同じです:若干のリトレース面とを待つと、明けの明星の後に買う前にパターンが形成される3つ目のローソク足の領域に市場が入っていきます。これを行う上で、トレーダーはより優れたエントリーを行うことになり、これは後の優れたリスク・リワードレシオを補います。リスク・リワードレシオと言えば、これは最低1:3とすべきであり、ロングトレードのストップロスは明けの明星の安値ポイントに置くべきです。通常、これはパターンの真ん中で形成されるローソク足で与えられます。反転パターンであるため、これも弱気が市場で優勢になるこのケースでは、強気派と弱気派の間の熾烈な戦いというテーマです。そのため、形成されるところの新たなトレンドの方向でロングに入る前に押しを待つのは、ごく普通のことです。
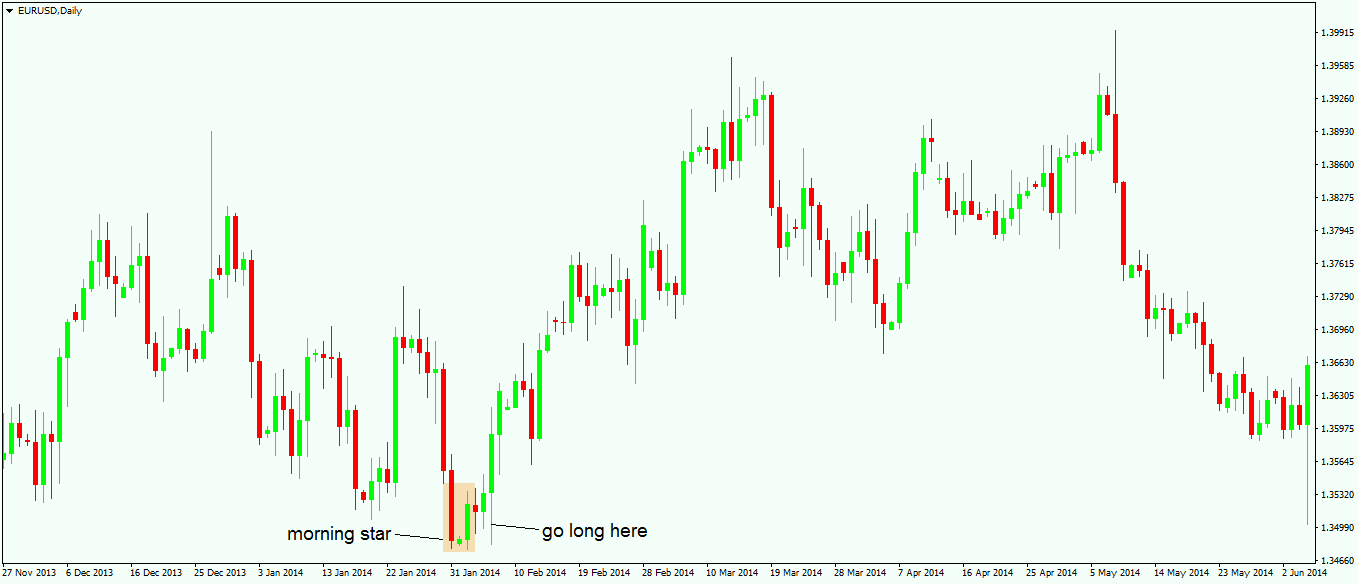
上記チャートは、EUR/USDペアの日足チャートで形成される明けの明星を示しており、それは上記のそのパターの全てのルールに従っています。パターンの安値は真ん中のローソク足で見られませんが、これは必ずではありません。ロング側のエントリーはトレーダーがリトレースメントを待ち、リスク・リワードレシオが簡単に見たらさせる場合、より良いものとなります。
宵の明星をトレードする
明けの明星にあることですが、宵の明星は、今回は日没前の空に現れる今回は金星にちなんで名づけられています。その名称がほのめかす様に、宵の明星は弱気のパターン、トップでの反転パターンであり、これから価格が下がることを示しています。明けの明星と宵の明星の両方は、最初と2番目のローソク足の本体の間にギャップがあるはずですが、外国為替市場の継続する性質があるため、これは必ずではありません。同時の場合のように、同じ始値と終値を持つ可能性はめったにない場合、同じことが最初の2つのローソク足間のギャップありここで行こうになります。宵の明星は、明けの明星のように、3本のローソク足から形成されます:
- 最初のローソク足は強気の緑のローソク足です。
- 2本目のローソク足は同時か首つり、あるいはこの2つが混ぜ合わさったものに似た何かのいずれかになります。
- 3番目のものは強い本体のある弱気の赤いローソク足です。
ルール通りとして、明けの明星や宵の明星のパターンの場合であるように、このパターンの最初のものと比較して3本目が長ければ長いほど、新たなトレンドが形成される可能性が高くなります。3本目のローソク足は、最低でも最初のローソク足の長さの50%である必要があります。
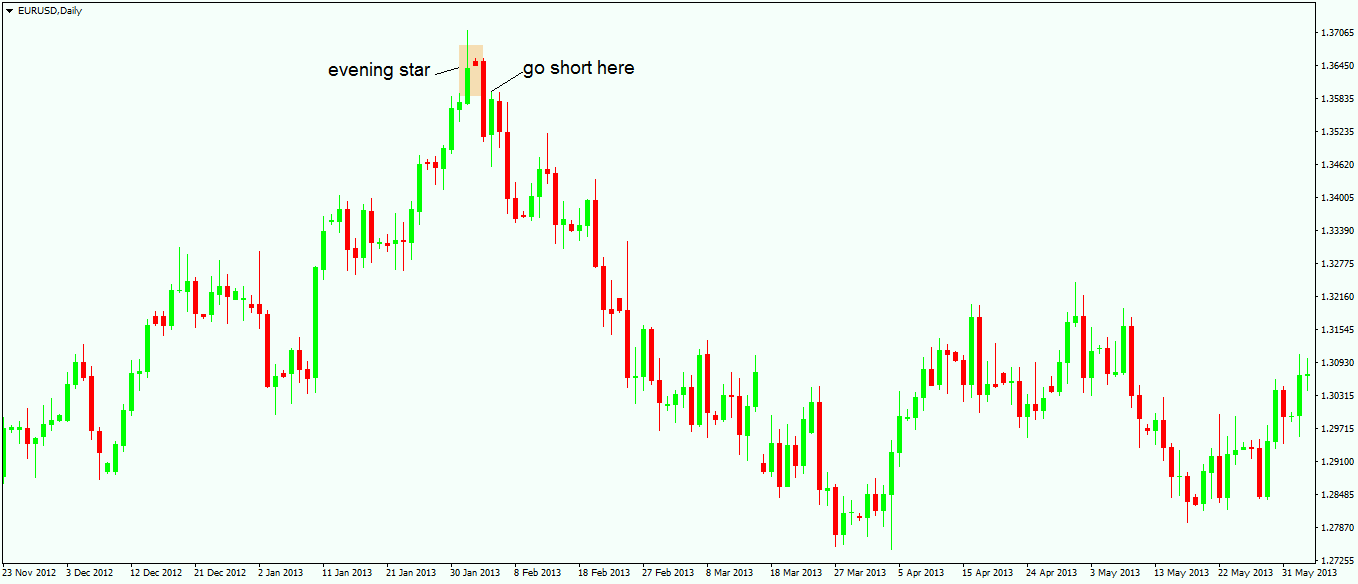
上記のチャートは最初のローソク足でもたらされた最高の点を持つ宵の明星を表しており、3本目のローソク足は最初のローソク足の長さのほぼ倍になっています。これは、続く弱気のトレンドが強いものであることを強力に表しています。そうであるにも関わらず、そうした宵の明星をトレードすることは、トレーダーが完璧なエントリーを目指している場合は、3番目のローソク足の領域に少しリトレースするのを待つ対象となります。このリトレースメントレベルは、少なくとも3番目のローソク足の38.2%であるべきです。リトレースメントの到来は必須ではないことをここで述べておくべきです。強力な明けの明星と宵の明星は、リトレースメントが続くわけではないのですが、3本目のローソク足後にすぐ、ロングやショートを行うリスクは大きすぎて無視されます。
様々な種類の明けの明星や宵の明星を差別化するもう1つのことは、真ん中のローソク足を検討することです。それが同時であったり、同時ローソク足に似ているローソク足である場合は、そのパターンが他のものよりも強力です。これまで説明した通り、明けの明星や宵の明星は、月足や週足チャートなど大きい時間枠で見た場合は特に、重要で強力な反転パターンです。今回リスク・リワードレシオで、パターンが形成される大きな時間枠であるため、結果として素晴らしい利益となる時のみ、同じトレーディングルールも適用されるべきです。外国為替トレーディングアカデミーでここでの日本のローソク足テクニックを扱った最後の記事は、多くのトレーダーの間で混乱を招く概念の説明を扱います:包み足とヒゲ足パターンの違い。それは全く似ていますが、差別化を図る必要があります。
2024 時点で最善で最も信頼される外国為替ブローカー
Other educational materials
- How to Use Parabolic SAR to Buy Dips or Sell Spikes
- Bollinger Bands – Profit from One of the Best Trend Indicators
- Price and Time – The Holy Grail in Trading
- Two Ways to Use Gaps When Trading Forex Markets
- Trade Forex with Fibonacci Retracement Tool
- Trade with Risk-Reward Ratios
Recommended further readings
- “What You Don’t Know About Candlesticks.” Bulkowski, Thomas N. Technical Analysis of (2011).
- BINDABLE CANDLESTICK CHART COMPONENT. Utomo, V. G. (2012). Jurnal Teknologi Informasi dan Komunikasi, 2(1), 35-40.