New Zealand dollar bouncing against Canadian dollar

The New Zealand dollar has bounced against the Canadian dollar during the trading session on Monday, continuing the bullish pressure that we have seen on Friday. In fact, this was right at the 61.8% Fibonacci retracement level, an area that should attract a lot of attention under normal circumstances anyway. With that in mind, this is worth paying attention to.
Major technical support
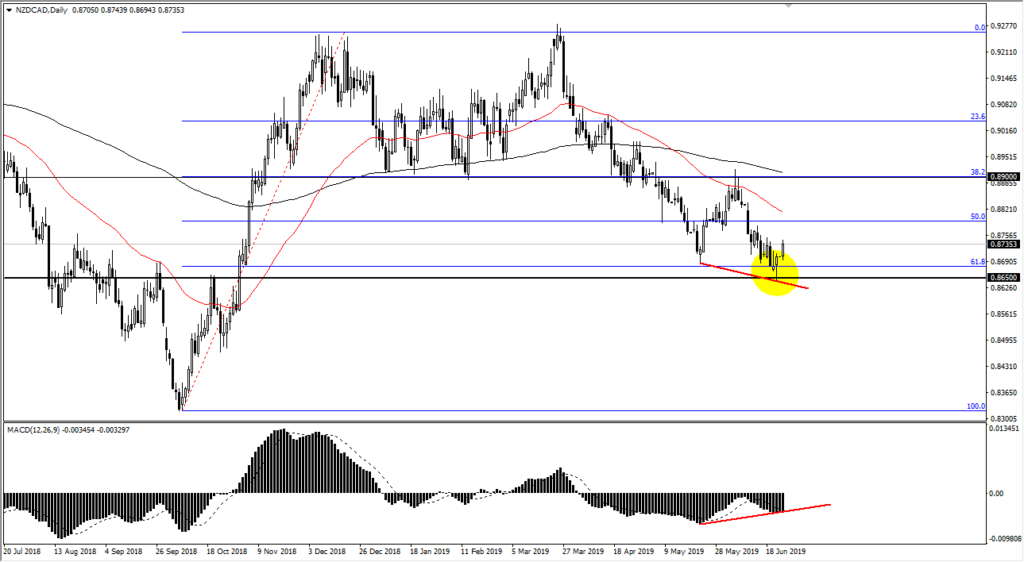
NZD/CAD chart
Looking at the chart, you can see that the 0.8650 level has offered support, but I also have a couple of lines on the chart marking that there is a bit of a divergence between price and the Moving Average Convergence Divergence indicator. That typically means that we are about to see a bit of a reversal, and the fact that we broke above the hammer that formed on Friday confirms that we are in fact trying to do that right now.
Between the 0.8650 level, the hammer on Friday, the divergence, and the fact that we have broken above the top of that hammer, it is very likely that we are going to continue to bounce a bit. That being said, there are resistance technical indicators above in the form of the 50 day EMA and of course the 200 day EMA. We had recently formed a “death cross”, but quite frankly I hate that term, which is defined as the 50 day EMA crossing below the 200 day EMA, because it’s normally well after the move lower, and typically closer to the bottom than the top.
Crude oil
Crude oil course has its influence on Canadian economic figures, and with the markets rally lately it makes sense that we have seen CAD strength. That being the case, the fact that the crude oil market has drifted a little bit lower suggests that the CAD needs to fall a bit. That being the case, we could continue to go towards the 50 day EMA above.
The play going forward
As far as this currency pair is concerned I suspect that this is the beginning of a larger move higher. As long as we can stay above the 0.8650 level, I think that you are closer to the bottom than the top. I do recognize that the red 50 day EMA could cause a bit of trouble, but I also recognize that if we can clear that level we should continue to go higher, perhaps reaching towards the 0.89 handle.
The alternate scenario of course is that we break down below the hammer from Friday, which would send this pair much lower, typically when you see a move like that at the 61.8% Fibonacci retracement level, you wipe out the entire move higher, meaning that we could go as low as 0.350 or so. However, it looks as if the buyers probably have control in the short term, so I think were much more likely to see a bounce closer towards the 0.89 handle, unless of course oil spikes again but it does look like it needs to retrace.

