Welcome to this week’s market roundup brought to you by TopRatedForexBrokers.
Global equity markets witnessed a heavy sell-off last week, as the rapidly spreading new coronavirus cases outside China fueled concerns of a global economic slowdown.
UK markets ended in negative territory, led by losses in consumer discretionary and energy sector stocks.
Currencies
On the currencies side, the USD ended mostly higher against its peers, after the US new home sales rose to its highest level since July 2007 in January.
The EUR ended higher against the USD, after the Eurozone consumer confidence advanced in February.
The GBP ended lower against the USD, after Britain threatened to walk away from the trade negotiations with the European Union if there is no progress by June.
Commodities
Gold prices fell last week, as strength in the US dollar drifted investors away from the safe-haven commodity.
Brent oil prices also fell, as a jump in the number of coronavirus cases in Europe and the Middle East raised fears over the crude oil demand.
Cryptocurrencies had another difficult week, with most major currencies seeing heavy losses across the board.
That wraps up another weekly market update. See you next time.

Welcome to this weekly review powered by TopRatedForexBrokers.
Global Stock Markets
A great week for the Global Stock Markets with all major indices finishing the week higher. The earnings season is looking strong so far in the US, with the American markets leading the way economically. The best performer this week was NASDAQ, which gained 2.29%, and the S&P 500 also reached fresh new highs this week.
Commodities
For commodities, crude oil closed flat, while the gold and silver markets dropped a little. Platinum was by far the biggest winner of the week, gaining more than 4%.
Platinum has broken out on the weekly chart and perhaps should lead the way for other metals.
Currencies and crypto
With currencies, the US dollar gained against most currencies apart from the Swiss franc.
Cryptocurrencies had an excellent week, with gains across the board. Bitcoin Cash was by far the biggest winner, gaining 40.59% for the week. However, Litecoin gained over 25%, while Ethereum gained roughly 19%. The least gains were seen in Bitcoin, but even that was more than a 10% gain.
That’s it for another weekly review. From all of us at TopRatedForexBrokers, we’ll see you next time.
- Crypto continues to underperform
- Litecoin facing large round figure above
- 50-day EMA in play
During the trading session on Tuesday, some weakness surrounding Litecoin was observed. This should not be a huge surprise considering that the cryptocurrency markets continue to get hammered longer term.
Litecoin is a secondary coin, so it is one of those situations where if the crypto markets rally, these coins should pick up more momentum. However, that is something we have not seen much of recently.
Technical analysis
Litecoin chart
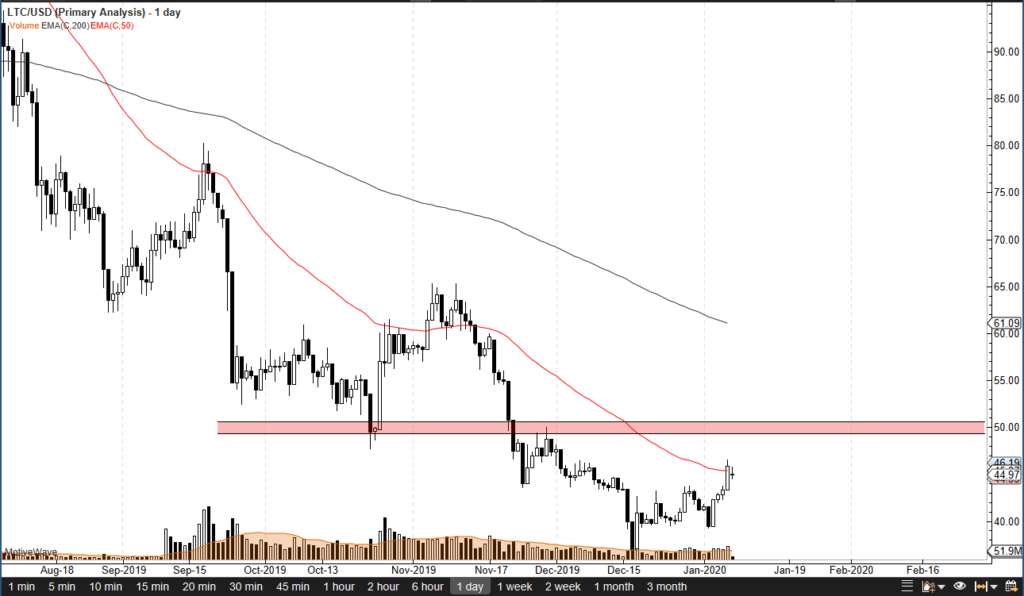
The technical analysis for this pair features several different moving pieces. The market gapped slightly lower to kick off trading during the session on Tuesday, and has gone back and forth since. What’s interesting is that we are at the 50-day EMA, an area that will cause a certain amount of attention, being a longer-term trading indicator.
After a nice rally over the last couple of weeks, the 50-day EMA will now have a lot of different traders looking at a number of things. Furthermore, the $50 level above should offer resistance based on the fact that it is a large, round, psychologically significant figure – just as it had previously been supportive all the way down. Looking at the chart, there is the possibility of a bounce in the short term, but clearly that’s an area that will attract a lot of attention from sellers.
That being said, crypto isn’t exactly in favor right now. That will continue to be one of the biggest problems with owning Litecoin, especially considering that, even though the geopolitical situation continues to get back, people are not using Bitcoin as a safety trade as they did in the past. In other words, if Bitcoin can’t get a boost, Litecoin certainly won’t.
Relief rally can be expected
The takeaway from this pair is that there may be a relief rally. Eventually though, the US dollar will overcome the crypto markets, with Litecoin being no different. The $50 level makes an ideal shorting opportunity, and therefore fading rallies that show signs of exhaustion would be the trade going forward, just as it has been for some time.
The $40 level underneath would be the target, and this “oversold bounce” could offer more of an opportunity. The outlook for crypto is murky at best, and gone are the days that just any crypto coin will go higher. That being said, if the market did break above the $50 level, the 200-day EMA currently trading at the $61 level will come into play as resistance.
- Ethereum drifting lower last couple of sessions
- Psychologically important $150 below
- Moving averages offer dynamic resistance
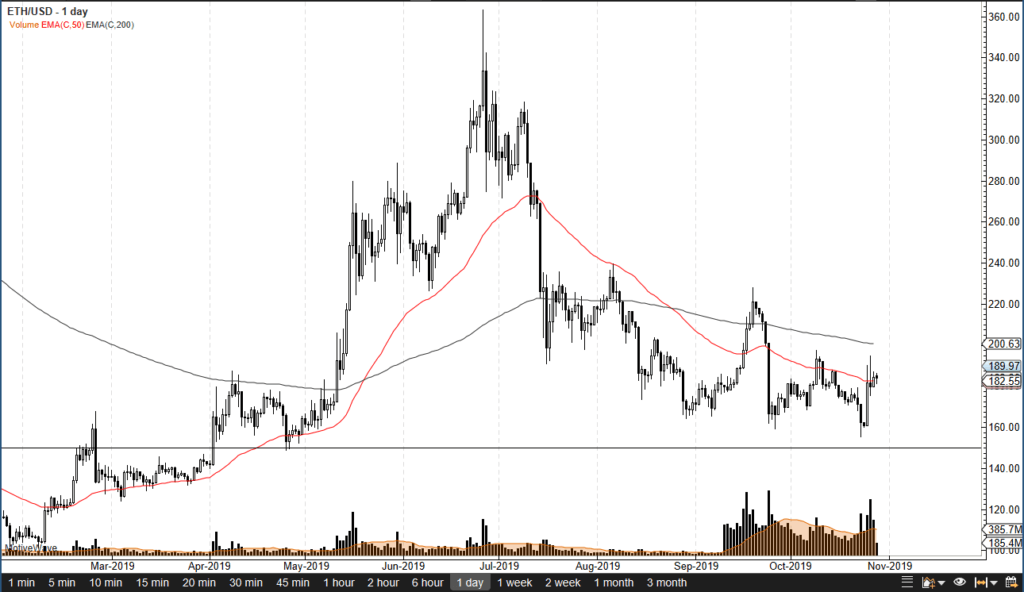
Ethereum, once one of the darlings of the cryptocurrency world, seems to be surrounded by the same kind of malaise that Bitcoin is. In fact, the last couple of months have not been good for cryptocurrency, as from July there has been a sizable drop in most major digital coins.
As a result, Ethereum has dropped from $300 down to $160 in the same amount of time, giving up 50% of its value.
Technical analysis
ETH/USD daily chart
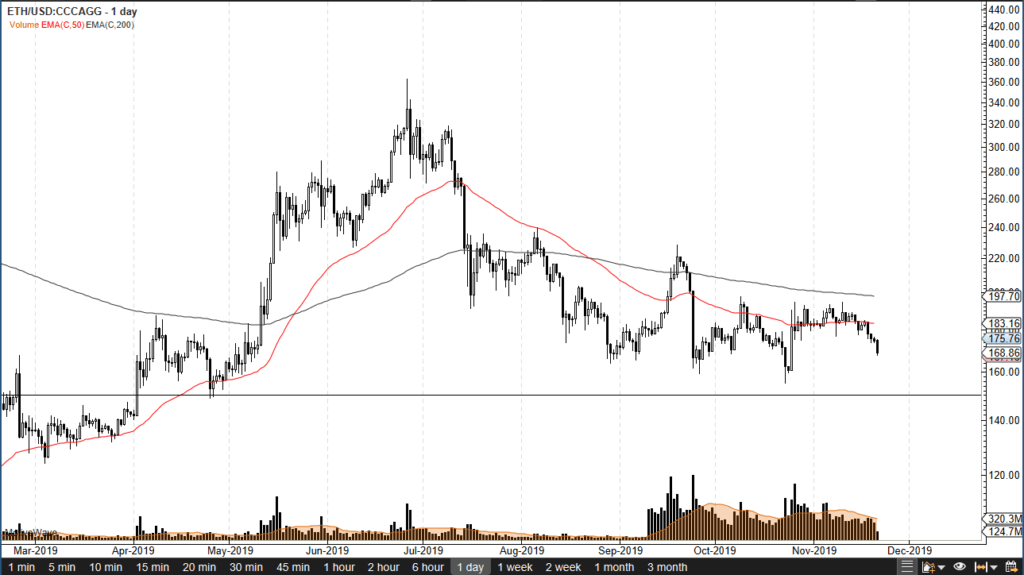
The technical analysis for the pair is rather dour, but there are some signs of hope at the psychologically important $150 level. Recently, the market bounced from there but continued to see an overall souring of demand for digital coins.
Currently, the 50-day EMA is offering dynamic resistance, just as the 200-day EMA is. Both are spread out from each other, but they are only slightly negative at this point, suggesting that perhaps there is hope after all.
The $150 level should offer some buying, but it should also be noted that if the market does break down below there, it’s very likely to go towards the $100 level next.
To the upside, the 50-day EMA is currently trading at the $183 level and will be the first barrier for buyers to overcome. After that, the 200-day EMA trading at $197 will offer even more resistance.
If the market was to turn around a breakthrough, it could change the overall attitude of Ethereum, but it will obviously need some type of catalyst. Right now, buying Ethereum is going to be more of a longer-term proposition than anything else.
Trader or investor?
At this stage, it comes down to whether you are choosing to be a trader or investor. If you are an investor, then building a position around the $150 level might make sense. After all, even just a round-trip to where the market started to fall in summer would mean doubling your position size.
However, if you are a trader, then you need to look at this as a market that is currently consolidating and has not proven itself to be significantly supported to simply buy-and-hold.
Because of this, trading back and forth between the $150 level in the $197 level would make more sense. As things stand right now, it looks like we are going to be visiting $150 much quicker than we will $197. Therefore, the short-term prognosis remains bearish in a market that has no reason to go higher in the immediate future.
Granted, cryptocurrency has a reputation for being extremely volatile and can jump 10% out of the blue, but those days are starting to go by the wayside as markets mature.
- Bitcoin still the leader
- Looking very soft
- Crypto markets losing volume
Bitcoin markets fell a little during the trading session on Tuesday, after falling even further on Monday. It looks very likely that the market is going to continue to struggle in general, as we have just simply started to drift lower and show signs of exhaustion.
Remember, as Bitcoin goes, so go the rest of the cryptocurrency markets. We have seen a lot of selling pressure more than once, and now that volumes are dropping, this is a bad sign for cryptocurrency as well.
Technical analysis
Bitcoin chart
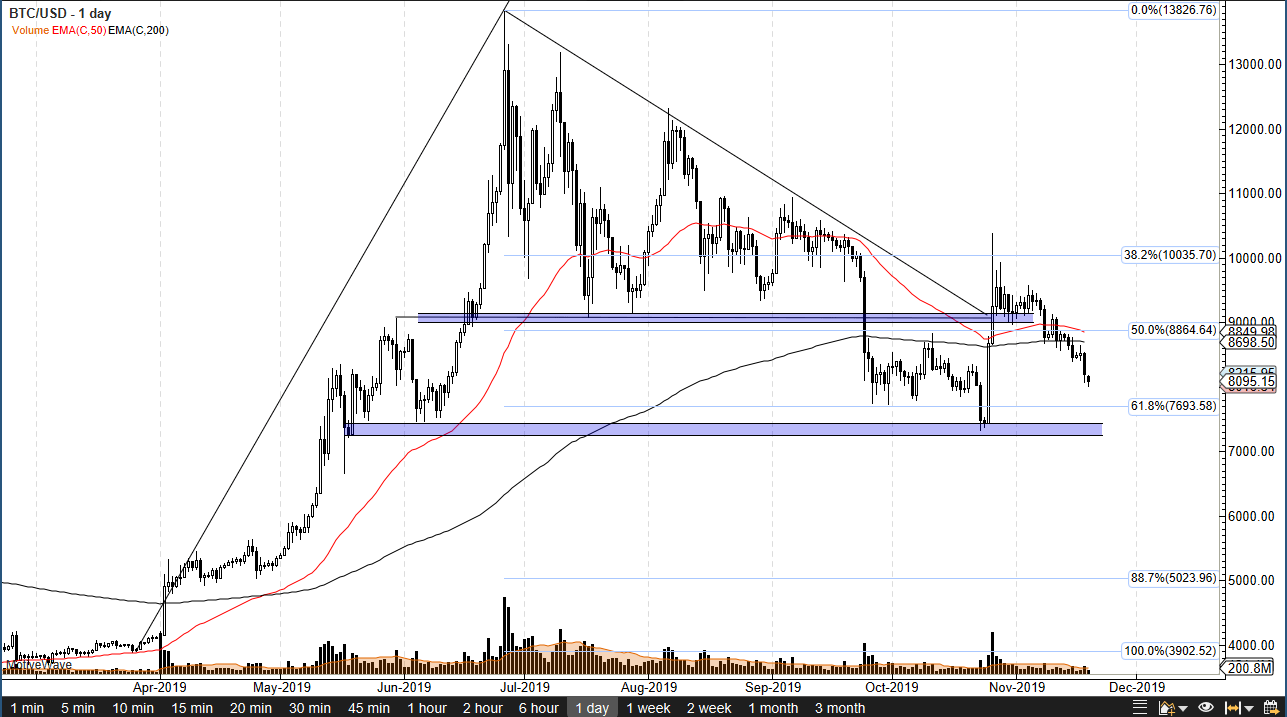
The 200-day EMA is currently sitting just above pricing, which is a very bearish sign. The fact that the markets have broken through first the 50-day EMA and then the 200-day EMA suggests that we are going to continue to struggle.
Underneath, the $7500 level was the scene of the most recent bounce and volume spike – which was the last time we had seen significant interest in the Bitcoin market. This coincides with the Chinese announcing that they were getting ready to do heavy research into blockchain. However, that’s not to be mistaken as saying that Bitcoin is something they are backing, so the reaction was a bit perplexing.
Beyond that, the reaction had the market rallying towards the $10,000 level but being unable to break above it. With that, it’s very likely that the market had come to its senses, realizing that the Chinese were not big fans of a vehicle that had been used to skirt capital controls.
Going forward
Regardless of what cryptocurrency you choose to trade, the Bitcoin market is something you should be paying attention to at all times. After all, it has a huge influence on the way the rest of the markets trade, due to the fact that it holds a huge majority of the trade in cryptocurrency. It is used as a secondary indicator for many other cryptocurrency markets, as it shows general strength overall.
Beyond that, one thing that should be noticed is that Bitcoin has been failing as central banks around the world continue to show signs of dovish behavior. This is a bit ironic, considering that Bitcoin is deemed to be the “antidote” of fiat currency.
If it can’t rally when central banks around the world are loosening monetary policy hand over fist, the question then becomes: when can Bitcoin rally for any significant amount? At this point, it’s clearly not a reality.
- Ripple forming large rectangle
- 200-day EMA just above
- 50-day EMA just below
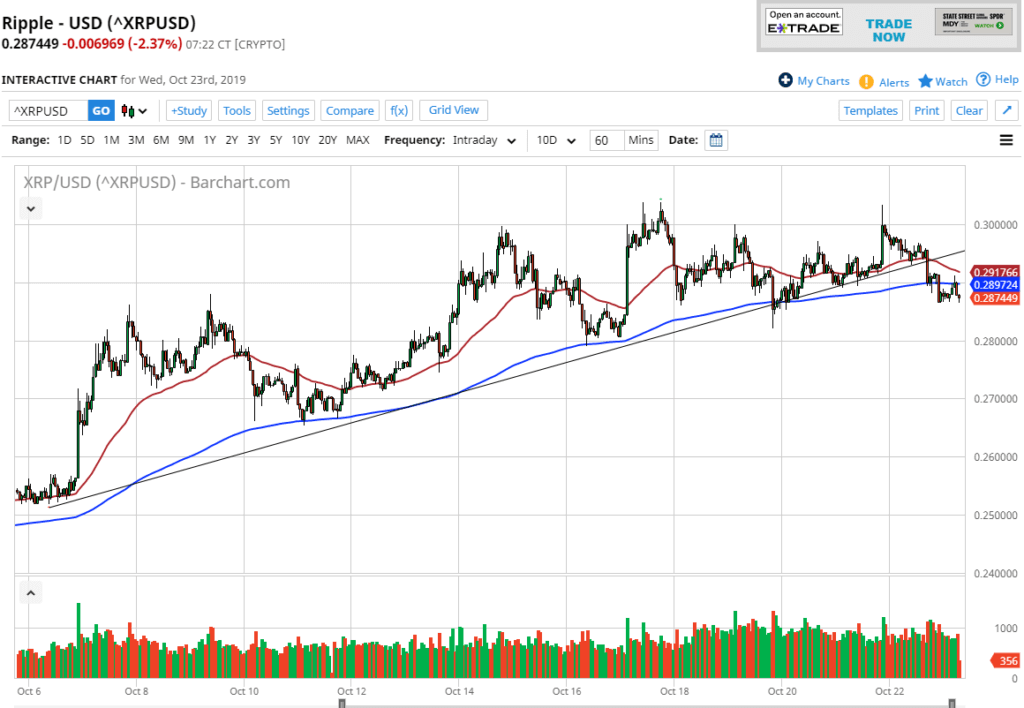
Ripple initially tried to rally during the trading session on Wednesday, before breaking down below the $0.30 level again. That being said, the market looks as if it is trying to confirm a potential rectangle. That could be a short-term pullback in the cards, going forward, for the Ripple market.
Technical analysis
The XRP/USD pair has initially shown strength over the last three sessions, but above the $0.30 level there is a significant amount of resistance. That resistance extends all the way to the $0.33 level. That is the top of the potential rectangle, and it isn’t exactly uncommon for there to be a “zone of resistance” at the top of one of these rectangles.
The 200-day EMA now sits just below the $0.33 level as well, so it makes sense that the market is going to struggle to get above here and break out. Having said that, if it did, it would be an extraordinarily bullish side.
The 50-day EMA sits just below, so we could get more of a grind sideways initially before a potential pullback. By breaking below the 50-day EMA, it’s likely that the market could go down to the $0.25 level underneath, which is the beginning of massive support that extends down to the $0.22 level after that.
All things being equal, the market does look as if it is trying to carve out a more stable consolidation area. Therefore, more back-and-forth trading is probably what you can expect in the short term.
Beyond the technical analysis on the chart, one should pay attention to the Bitcoin market, being a proxy for the overall attitude of the cryptocurrency markets. Most of the smaller coins will struggle if Bitcoin cannot show strength, so it’s important to ascertain how this cryptocurrency is trading before placing the trade in one of these markets.
The trade going forward
Looking at the chart, the trade going forward is to employ some type of range-bound system.
That being said, if the market does close above the $0.33 level, it’s very likely that it will continue to go higher, perhaps reaching as high as $0.40 going forward. To the downside, if the market was to break down below the $0.22 level, the $0.20 level would be targeted next due to the large, round, psychological significance of that figure.
Until something changes drastically, though, this could be a perfect trading vessel for short-term traders. The market continues to see a lot of choppiness, and if you can sit with your trade, you can do quite well in these types of situations. That being said, for the longer-term trade, the upside makes more sense.
- Crossing 50-day EMA
- Breaking above $60
- Recently bounced from high-volume
Monero, just like the other crypto markets, has been hammered over the last several months. But this crypto is starting to turn things around, reaching towards the 50-day EMA.
Over time, it has been proven that crypto cannot hang on to gains for any significant amount of time until Bitcoin does the same. It is a massive amount of volume when it comes to this asset class, so at this point, no matter what you are trading, you should have Bitcoin available to monitor.
Technical analysis
XMR/USD chart
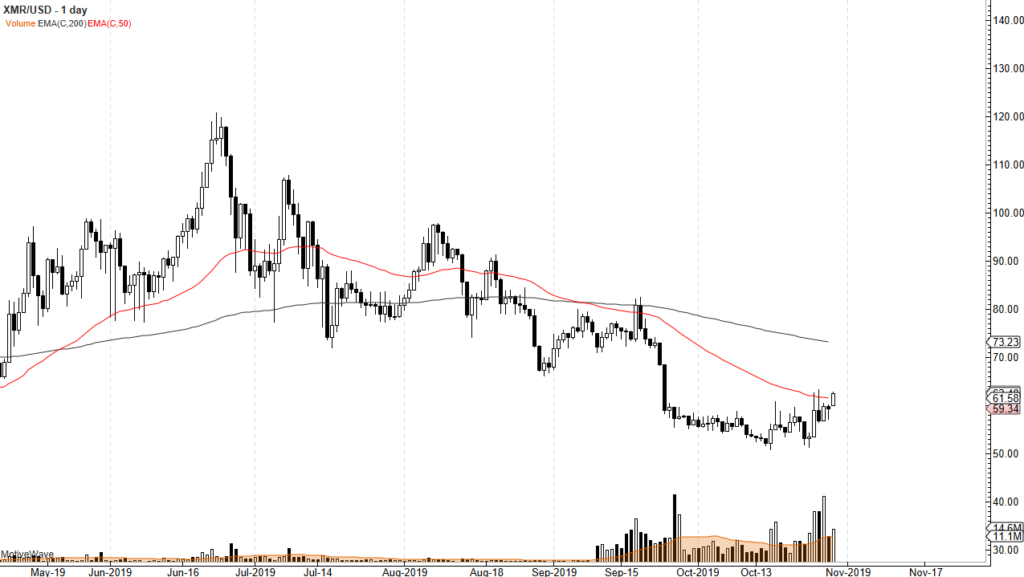
The technical analysis for this currency is very bullish, as Monero has crossed the 50-day EMA during the trading session on Wednesday. Not only that, but the volume has been relatively strong lately.
The shooting star from a handful of sessions ago also shows significant resistance that is now being tested. Now that we are seeing this market break this area again, it’s very likely that there will be a significant move to the upside. At that point, technical analysis suggests the market would head to the next large, round, psychologically significant figure of $70.
To the downside, the $60 level should offer a bit of support now that the market has broken above there. It should also be noted that there is a significant amount of volume in that range of price. Ultimately, the market also has formed a bit of a “rounded bottom”.
Overall, the market could not only go to the $70 level, but perhaps to the 200-day EMA that’s currently trading at the $73.23 level. In other words, Monero has a bit of range to continue driving higher.
The trade going forward
The trade going forward is relatively simple when it comes to Monero. There are two things you should keep in mind almost immediately.
The first is to pay attention to what Bitcoin is doing. If it is rallying, and Monero is doing the same, it builds quite a lot of confidence in the upside. At that point, buying every time it dips makes quite a bit of sense. This looks as if it is a trend reversal, just as we are seeing in several other currencies in the crypto markets.
The alternate scenario would be a turnaround and a break below the $50 level. If that happens, and a daily candlestick closes below there, then it is a sign of selling pressure just waiting to happen again. At that point, the market could very well find itself reaching towards the $40 level. That said, based on recent action, it seems to be a lot less likely than the bullish case.
Overall, it looks as if “a rising tide is lifting all boats” in the case of Bitcoin, as it is lifting not only Monero, but several other coins too.
- Ethereum shows recent momentum
- Testing major moving averages
- Has obvious support below
Ethereum has rallied over the last several days, although it slowed down over the weekend. By doing so, Ethereum has shown the resilience that was necessary after the recent beating the cryptocurrency has taken. That being said, it isn’t out of the woods yet, and there is a significant amount of resistance above that is going to come into play.
Crypto has underperformed drastically lately as money flew away from fiat currency and into precious metals. At the same time, crypto was simply shunned.
Technical resistance above
ETH/USD technical chart
The market has a lot of technical resistance just above current pricing. The 200-day EMA is currently trading just above the $200 level. That is also a figure that will attract quite a bit of attention by itself. In fact, you can see we have already been there twice, and both times have seen sellers jump back into this market.
That being said, though, the market looks very likely to find another attempt in the cards.
The weekend attempt to break out was due to the sympathy of the Bitcoin market. After the Chinese president suggested that crypto was a viable alternative, there was a sudden spike over the weekend. However, the real test will come when institutional traders are involved.
The Monday candlestick does show a bit of resiliency, and the market is now above the 50-day EMA, which is a longer-term trend-trading mechanism. It looks as if it is trying to form support.
Beyond all of that, the 200-day EMA will cause a lot of interest in the market. The market currently sits between these two moving averages, but what should be noted is that the initial spike higher ended up forming a shooting star.
The shooting star is very negative, but if the market breaks above there, then one would have to think that the 200-day EMA would be targeted next. A break above that level would be a very bullish sign from not only slicing through a major moving average, but also through taking out a large, round, psychologically significant figure.
Trading Ethereum going forward
At this point, it’s highly possible that short-term pullbacks will continue to offer buying opportunities. However, if the shooting star from the Saturday trading session was broken to the downside, it would then be a sign that the market was to reach down towards the $160 level.
The market could very well become extraordinarily bearish again. Regardless, it’s most likely to be a very choppy set of conditions, so a certain amount of resiliency should be needed if you plan on going long of this market.
- Broken trend line to the downside
- 200 EMA just above
- Crypto slumping in general
The Ripple markets have been sideways for quite some time, as cryptocurrency markets have struggled to gain a footing. With that, market participants have shown a proclivity to simply go sideways and do nothing. Meanwhile, central banks around the world doing everything they can to boost them by cutting interest rates, adding quantitative easing, and many other schemes.
Ripple, of course, is a relatively small coin and therefore secondary to places in markets like Bitcoin. Bitcoin has struggled quite a bit recently and has broken through a descending triangle, which of course is a very ominous sign for other cryptocurrencies such as Ripple, Ethereum, Litecoin, and many others. Quite frankly, if Bitcoin cannot take off to the upside, none of these other markets have any significant chance.
Trend line break
The trendline that has recently been broken had been very supportive for some time, but then got broken. The 200 EMA has been broken through to the downside, showing signs of rolling over and breaking down from there as well. With that being the case, it’s likely that the $0.28 level could be targeted, perhaps even lower than that.
Technical analysis
The technical analysis for this pair is, of course, that the trend is starting to change. Now, it is only a matter of time before a breakdown kicks off a shorting opportunity. At this point, cryptocurrencies look like they are sliding. Most profit will be made shorting these markets.
Below the $0.28 level, the next support level is at the $0.27 level, and then eventually the $0.25 level. To the upside, there is the 50-day EMA, which is crossing the $0.29 level, and the previous trendline, both causing significant resistance. With that in mind, it’s very likely that rallies will be sold into as well.
Ripple technical analysis
Fundamentally broken
It’s only a matter of time before the crypto markets will need to be whittled down to a few viable coins. Ripple may be viable due to the fact that it allows for transactions internationally through large banks, but the question is whether or not those banks choose to use it for their own coins, something that Ripple has to deal with.
Recently, it was seen to be the case. It’s likely that the market will stay viable over the longer term, but clearly it can’t hold significant value. The oversupply of coins for the market currently will continue to put downward pressure, especially if the “King” of crypto, Bitcoin, cannot get much of a bid these days. At this point, the crypto markets are starting to reflect real value and less speculative pressure.
- Bitcoin continues to test 200-day EMA
- Crypto continues to struggle
- Not moving with central banks
- Descending triangle broken
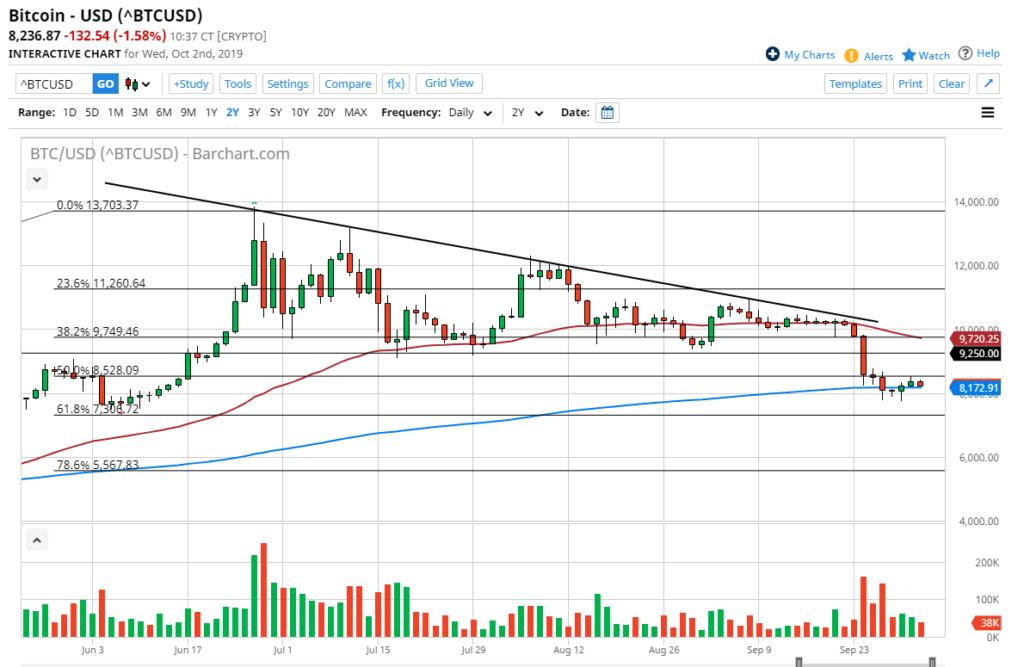
Bitcoin has broken down through a major descending triangle recently, breaking below the $9250 level. By doing so, it kicks off a very negative pattern that could send the market as low as $4800, but obviously there is a lot of work to get through to get to that level. That being said, the Bitcoin market has been decidedly bearish, or at least lackluster over the last couple of weeks, as cryptocurrency starts to fall out of favor again.
Technical analysis
The charts in this market look rather rough. The latest move obviously was very negative before the last couple of days started the consolidation that we are currently dealing with. The market is sitting on the 200-day EMA, which of course attracts a lot of attention from technical traders, as it is quite often used as the long-term indication of a trend. In other words, a lot of longer-term traders are starting to focus on whether or not we are still in an uptrend, or if we’re about to enter a downtrend.
The 50-day EMA above, shown in red, is currently at the $9720 level and tilting lower. This suggests that short-term traders will be looking to fade rallies as they occur, and especially at the first signs of exhaustion. Quite frankly, the market could tread water for a while, but it will make it an explosive move in one direction or the other. If the descending triangle from previous trading is to be believed, that move should be lower.
Bitcoin Technical Analysis
Bitcoin fundamentals
Quite a few people out there will focus on things like hash rate, network speed, and other such technical factors when it comes to the Bitcoin network. The biggest problem that Bitcoin has right now is that it simply isn’t being adopted by wealthier countries. Yes, there are parts of the world where Bitcoin is used frequently, but that normally involves either a very small economy or a place where capital controls are in effect. One example was China recently adding more capital controls to keep money within the country. As it was leaving, quite often it was leaving via Bitcoin. That move has been made, and since then we have seen Bitcoin take a bit of a hit.
Beyond all of that, central banks around the world continue to ease monetary policy, yet crypto isn’t taking off. It isn’t moving with gold as it had been earlier in the cycle, showing that the traders are trying to get away from fiat to protect their wealth. Simply put, the whole “gold 2.0” scenario isn’t playing out.
The trigger
A potential trigger for a trade could be a break down below the range on Monday, as it would break the back of a hammer. That suggests that below the $7775, we will see sellers come in and continue to push this market lower. If the market breaks above the $8500 level, then the $9250 level will more than likely be tested again for potential resistance, as it was such reliable support for so long. At that point, signs of exhaustion will be sold into.

