- Ethereum sitting at major resistance
- Crypto sees recent breakout
- Use Bitcoin as a secondary indicator
Ethereum has gotten lost in the shuffle when it comes to cryptocurrency markets recently, mainly because a lot of attention is being paid to Bitcoin.
However, it is lagging slightly in reaction to Bitcoin when compared to the usual trend, but it is starting to approach a very interesting technical area. Because of this, there should be a “catch-up trade” happening in this market.
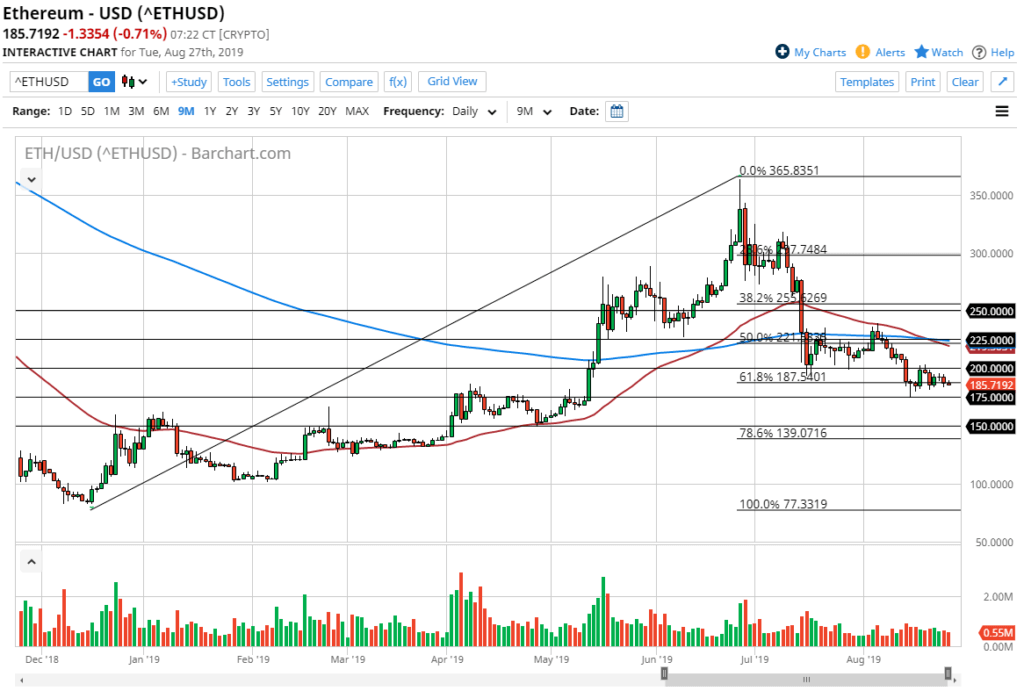
ETH/USD 6-monthly chart
The Ethereum chart analysis
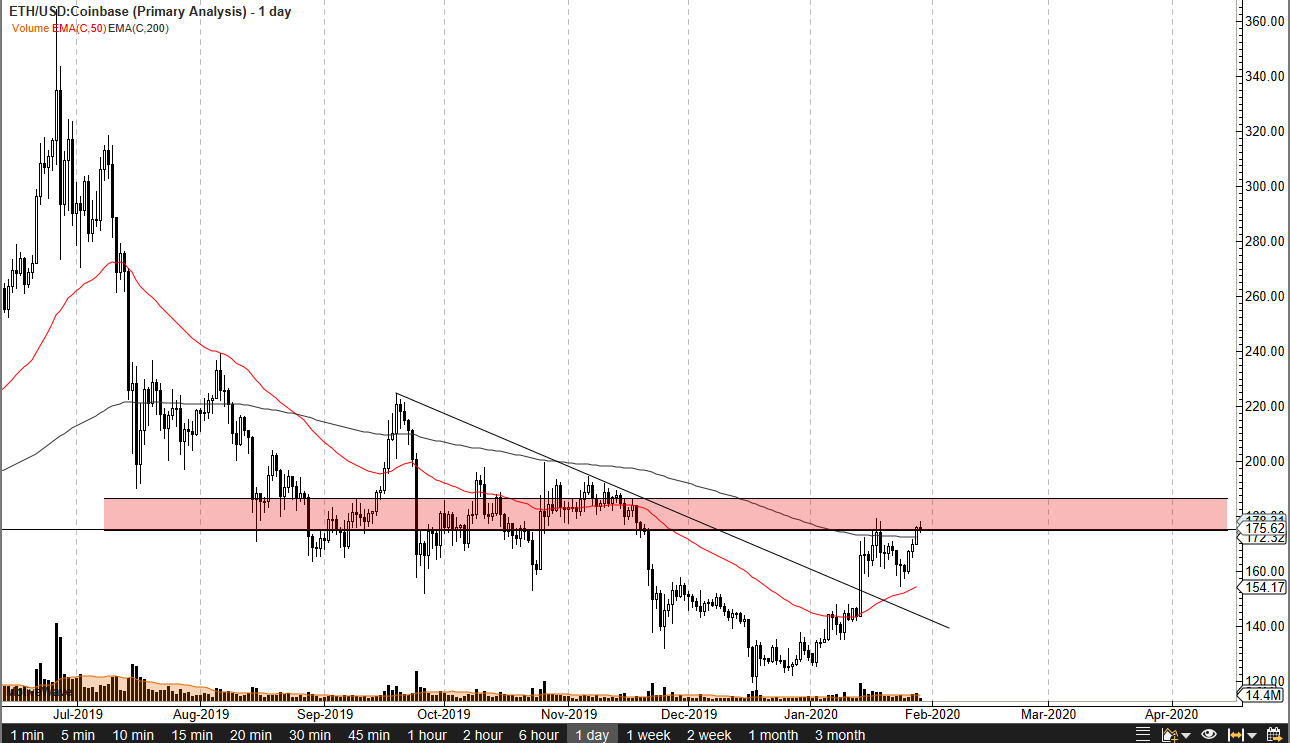
The technical analysis for Ethereum right now is very interesting considering that the market is pressing up against the $175 level. That is an area that has offered massive support and resistance in the past, and it is a fulcrum for price.
Additionally, the market has just broken above the 200-day EMA, an area that causes significant resistance. With that being the case, the question now is whether or not it can continue the upward momentum.
It’s very likely that there will be a lot decided as far as the future of Ethereum in this area, with a lot of noise extending all the way to the $200 level. However, one of the easiest ways to play this market under typical conditions is to pay attention to what’s going on in the Bitcoin world.
If Bitcoin rises, as a general rule it will lift the other crypto markets right along with it. In this scenario, it offers the ability for traders to take advantage of the correlation.
Otherwise, if the market breaks down from here, the 50-day EMA, pictured in red on the chart and currently sitting at the $154 level, could come into play as support.
The market had recently broken above a downtrend line that attracts a lot of attention. By doing so, it was the first sign that perhaps a bullish trend was starting to form. The next couple of weeks should be crucial for Ethereum, as it looks like a serious move could be on the cards.
The play may be over here
The main takeaway from this market is that, while everybody is paying attention to Bitcoin, the real play may be over here. This is because if Bitcoin can crack the $10,000 level, it should send a fresh supply of money into the cryptocurrency markets in general, and into markets such as Ethereum.
With that being the case, the market will most probably be able to easily break above the $200 level, given enough time. However, if Bitcoin rolls right over again, this market will potentially go looking towards the 50-day EMA, and possibly even look to test that downtrend line yet again.
The setup is relatively straightforward, with Bitcoin being a very important secondary indicator.

- Ethereum continues to show malaise
- Downtrend in crypto overall
- Heading towards $100 support level
Ethereum continues to show a significant amount of malaise as it simply can’t go anywhere. Looking at the chart, it has been drifting lower for some time. This coincides quite nicely with the overall cryptocurrency markets, which simply can’t get a boost these days.
With that being the case, it’s not a surprise to see this market drifting below the $150 level. Ethereum tends to be the “little brother” of other cryptocurrencies, such as Bitcoin. As long as Bitcoin struggles, Ethereum won’t do much better.
Crypto in downtrend
Crypto markets have been in a downtrend for several months. Bitcoin simply cannot find adoption and is far too volatile to be used as currency. That only leaves speculators and it has recently come out that the amount of Bitcoin holders out there is relatively small when it comes to the larger amounts. If that’s the case, then this is a market that will remain very dangerous.
As such, the “little brother” won’t fare very well. Looking at Ethereum, one can see that the 50-day moving average, indicated in red on the chart, has offered dynamic resistance for some time.
The-200 day EMA, marked in blue on the chart, is also well above current pricing. This suggests that the $200 level will not only be interesting due to the fact that it is a large, round, psychologically significant figure, but also because the 200-day EMA is sitting there, which will be massive in its ability to cause resistance.
A slow and steady descent
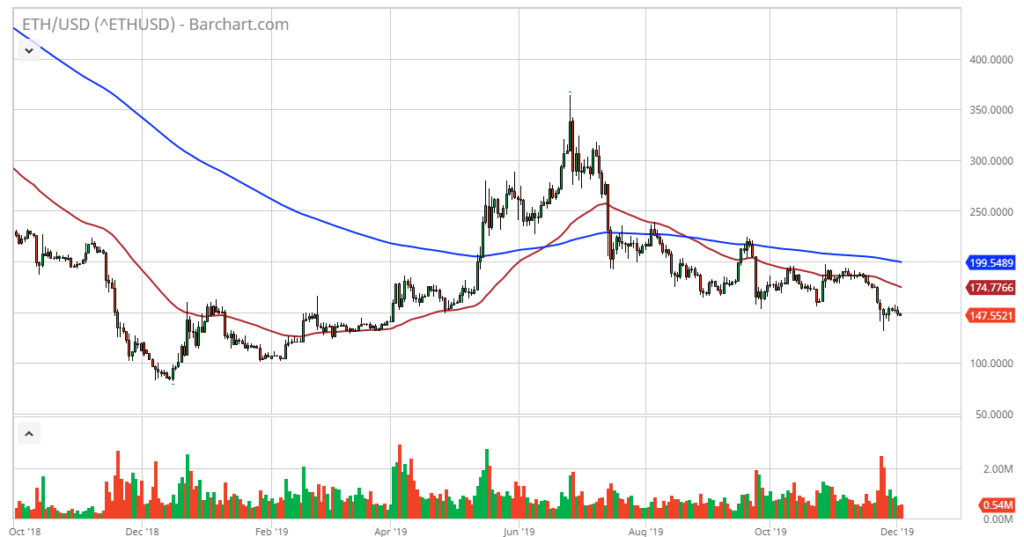
Ethereum yearly chart
Ethereum looks likely to be heading towards the $100 support level, which is the scene of the most recent uptrend. It has been a slow and steady descent to that level, so that is much more likely to be sustainable as a downtrend, as it hasn’t been impulsive.
Previously, once the $100 level was tested, the Ethereum market bounced rather significantly. It is because of this that a technical analysis-driven trader will expect to see some support in that area. That’s not exactly a stretch considering it is such a large, round, psychologically significant figure.
It looks as if rallies will continue to be sold, as there is simply no reason to think that things are going to change in the short term. Central banks around the world continue to be very loose with their monetary policy, and even Bitcoin can’t pick itself up off the floor.
In that scenario, Ethereum stands no real chance to gain. A result, it remains a good option for a short trade, or perhaps something traders may wish to look towards at lower levels in the future.
- Ethereum drifting lower last couple of sessions
- Psychologically important $150 below
- Moving averages offer dynamic resistance
Ethereum, once one of the darlings of the cryptocurrency world, seems to be surrounded by the same kind of malaise that Bitcoin is. In fact, the last couple of months have not been good for cryptocurrency, as from July there has been a sizable drop in most major digital coins.
As a result, Ethereum has dropped from $300 down to $160 in the same amount of time, giving up 50% of its value.
Technical analysis
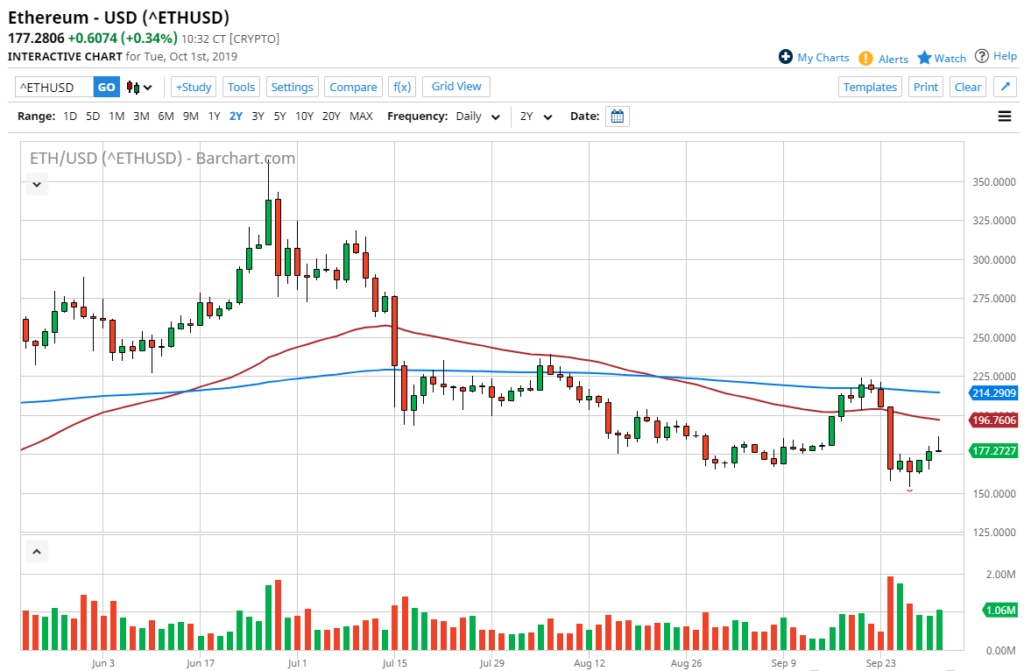
ETH/USD daily chart
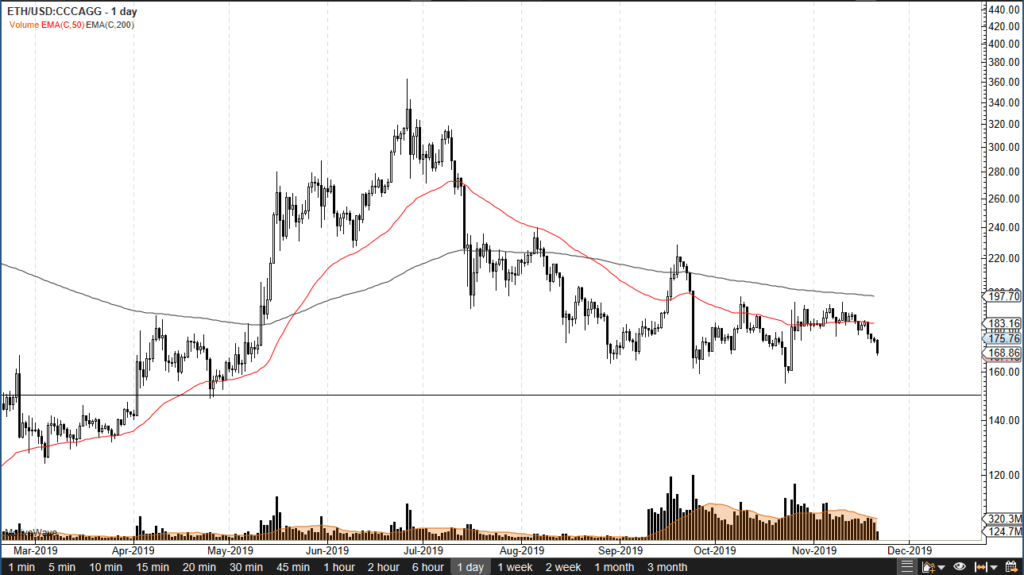
The technical analysis for the pair is rather dour, but there are some signs of hope at the psychologically important $150 level. Recently, the market bounced from there but continued to see an overall souring of demand for digital coins.
Currently, the 50-day EMA is offering dynamic resistance, just as the 200-day EMA is. Both are spread out from each other, but they are only slightly negative at this point, suggesting that perhaps there is hope after all.
The $150 level should offer some buying, but it should also be noted that if the market does break down below there, it’s very likely to go towards the $100 level next.
To the upside, the 50-day EMA is currently trading at the $183 level and will be the first barrier for buyers to overcome. After that, the 200-day EMA trading at $197 will offer even more resistance.
If the market was to turn around a breakthrough, it could change the overall attitude of Ethereum, but it will obviously need some type of catalyst. Right now, buying Ethereum is going to be more of a longer-term proposition than anything else.
Trader or investor?
At this stage, it comes down to whether you are choosing to be a trader or investor. If you are an investor, then building a position around the $150 level might make sense. After all, even just a round-trip to where the market started to fall in summer would mean doubling your position size.
However, if you are a trader, then you need to look at this as a market that is currently consolidating and has not proven itself to be significantly supported to simply buy-and-hold.
Because of this, trading back and forth between the $150 level in the $197 level would make more sense. As things stand right now, it looks like we are going to be visiting $150 much quicker than we will $197. Therefore, the short-term prognosis remains bearish in a market that has no reason to go higher in the immediate future.
Granted, cryptocurrency has a reputation for being extremely volatile and can jump 10% out of the blue, but those days are starting to go by the wayside as markets mature.
- Sitting just above 50-day EMA
- Stubborn price action
- Recent “double bottom”
Ethereum has been relatively quiet over the last several weeks as the month of October saw the cryptocurrency trade between $160 on the bottom and $190 on the top. This is a relatively tight range for an entire month, as the market tends to be very impulsive at times.
Because of this, there are a couple of questions that could come to mind rather quickly. One such question would be whether or not Ethereum is trying to build a base pattern from which to jump higher.
Technical analysis
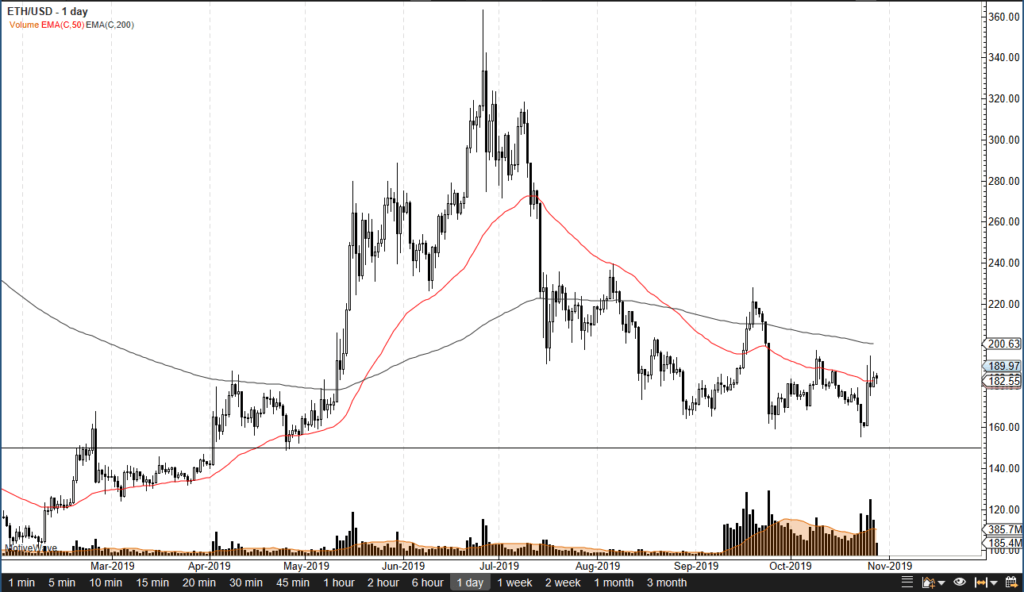
ETH/USD 6-month chart
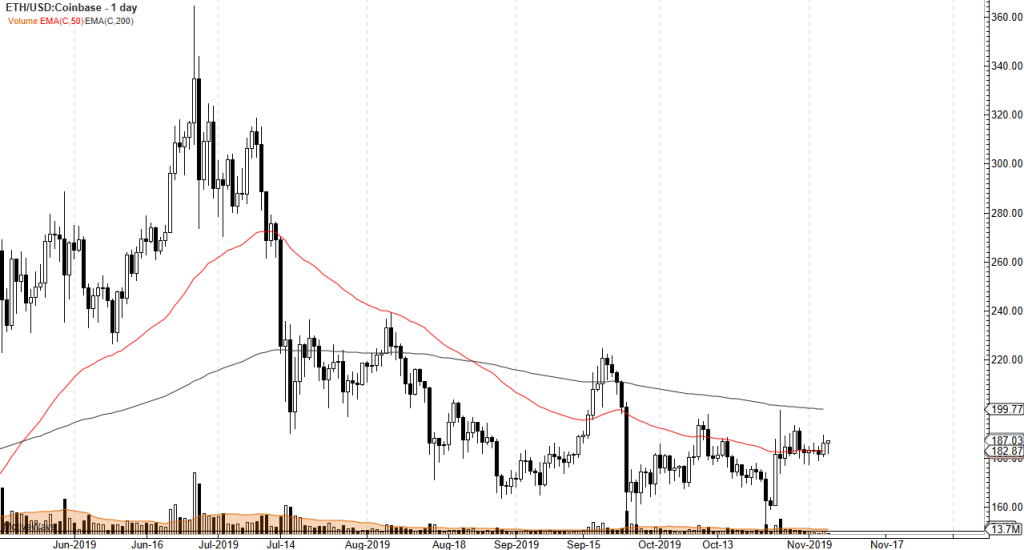
Ethereum has been relatively quiet, but that isn’t necessarily a bad thing. After all, the summertime saw a lot of selling when it came to the cryptocurrency markets in general, and the fact that we have decelerated the selling is a very good sign to begin with.
Beyond that, the market has recently formed a bit of a “double bottom” near the $160 level. This should continue to be looked at as a “floor” in the market, as long as we can stay relatively stable.
The 200-day EMA is just above, which could cause some issues as far as resistance is concerned, but it is close to the $200 level. Ultimately, this is a market that will probably be relatively quiet, but again, that could very well be a good thing.
The trade going forward
Using the recent double bottom as a bit of a floor allows traders to build a core position to go forward. Short-term dips can offer buying opportunities, and if you take advantage of the opportunity to buy in small bits and pieces, the ability to build up a larger core position will be one of the biggest advantages of being a retail trader.
At this point, as long as the market stays above that double bottom from the month of October, buying little bits and pieces along the way can mitigate the amount of potential loss that you could be facing.
On a break above the 200-day EMA, especially on a daily close above that level, it should send the market much higher. At that point, Ethereum is likely to go looking towards the $220 level, and eventually the $250 level after that.
If the market does break below that double bottom, reaching the $150 level would be extraordinarily negative. It would also probably send the Ethereum market looking towards the $125 level, and even quite possibly down to the $100 level.
All things being equal though, it does look like buyers are starting to create an opportunity.
- Ethereum shows recent momentum
- Testing major moving averages
- Has obvious support below
Ethereum has rallied over the last several days, although it slowed down over the weekend. By doing so, Ethereum has shown the resilience that was necessary after the recent beating the cryptocurrency has taken. That being said, it isn’t out of the woods yet, and there is a significant amount of resistance above that is going to come into play.
Crypto has underperformed drastically lately as money flew away from fiat currency and into precious metals. At the same time, crypto was simply shunned.
Technical resistance above
ETH/USD technical chart
The market has a lot of technical resistance just above current pricing. The 200-day EMA is currently trading just above the $200 level. That is also a figure that will attract quite a bit of attention by itself. In fact, you can see we have already been there twice, and both times have seen sellers jump back into this market.
That being said, though, the market looks very likely to find another attempt in the cards.
The weekend attempt to break out was due to the sympathy of the Bitcoin market. After the Chinese president suggested that crypto was a viable alternative, there was a sudden spike over the weekend. However, the real test will come when institutional traders are involved.
The Monday candlestick does show a bit of resiliency, and the market is now above the 50-day EMA, which is a longer-term trend-trading mechanism. It looks as if it is trying to form support.
Beyond all of that, the 200-day EMA will cause a lot of interest in the market. The market currently sits between these two moving averages, but what should be noted is that the initial spike higher ended up forming a shooting star.
The shooting star is very negative, but if the market breaks above there, then one would have to think that the 200-day EMA would be targeted next. A break above that level would be a very bullish sign from not only slicing through a major moving average, but also through taking out a large, round, psychologically significant figure.
Trading Ethereum going forward
At this point, it’s highly possible that short-term pullbacks will continue to offer buying opportunities. However, if the shooting star from the Saturday trading session was broken to the downside, it would then be a sign that the market was to reach down towards the $160 level.
The market could very well become extraordinarily bearish again. Regardless, it’s most likely to be a very choppy set of conditions, so a certain amount of resiliency should be needed if you plan on going long of this market.
- Ethereum fails to hang onto gains
- 50-day EMA tilting lower
- Running into resistance
- Crypto under pressure overall
As the cryptocurrency markets have been under significant pressure recently, it should not be much of a surprise that Ethereum has fallen as well. It hasn’t exactly been a meltdown, but it certainly has been somewhat relentless in its bearish pressure. It’s very possible that crypto is about to get hammered for a longer-term move.
Moving averages
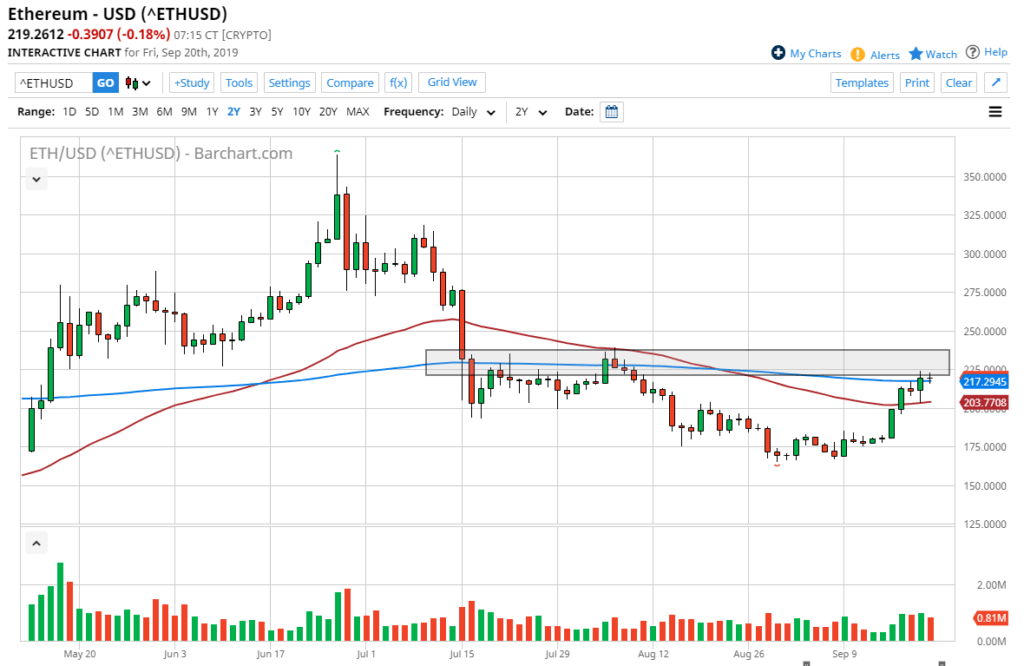
ETH/USD weekly chart
Looking at the chart, there is a 50-day moving average just above that is tilting lower, and that will bring the short-term sellers. Above there, the 200-day EMA is found at $215, and it is now starting to slope a bit lower as well. As there is a decent spread between these two major moving averages, it suggests that the market is ready to go lower for the longer-term move. Recently, the market had tested just above the $150 level, which has a certain amount of psychological importance attached to it. That doesn’t mean it can’t be broken down though, and it’s very likely that there will be a significant attempt to do just that.
Lack of use
There has been a serious lack of use when it comes to real-world application, and this is starting to become a serious problem for crypto in general. In fact, the question now is whether or not crypto will survive in its current form? The reality is probably not, but there will more than likely be a few survivors. As Ethereum is one of the top cryptocurrencies, it’s likely that it will be around in a few years. That doesn’t mean it has any business whatsoever in trying to break higher from here. The best thing that can happen for crypto is that it drops in value overall, as it is far too expensive and volatile to be taken seriously as a currency, or even as a way to transact.
The trade going forward
Looking at the Ethereum chart, and the fact that the buyers disappeared later in the trading session on Tuesday, suggests that selling short-term rallies should continue to be the way forward. The 50-day EMA should be used as a benchmark for selling as well if the opportunity arises, and it’s likely that the market will roll over and go looking towards the $150 level. A break down below that level will open up the door to the $125 level next, and then possibly the $100 level after that.
It is not until the market breaks significantly above the 200-day EMA that the buyers will be followed by a longer-term group of traders that can truly push this market to the upside.
- Ethereum forming potential “rounded bottom”
- The cryptocurrency has crossed the 50-day EMA
- The coin’s value rises above $200
Ethereum markets have rallied over the last couple of weeks to form what is starting to look very much like a “rounded bottom” support pattern. This is quite often found at the end of a downtrend, and can signify that the next leg higher is getting ready to start. If that is the case, it is important to be watching the level just above, as it is essentially the top of the pattern. In other words, we may be on the cusp of a large technical breakout.
Ethereum daily chart
Measured move
When a market forms a large “rounded bottom”, it suggests that there has been a slow and gradual turnaround in the selling pressure. In other words, people have been buying the market slowly and deliberately, indicating real demand. Currently, the Ethereum market looks as if it has the top of this pattern roughly at the $230 level, with a bottom closer to the $170 level. Based on measured moves, this suggests that a breakout could send this market towards the $290 level, possibly even as high as $300. Rounded bottom patterns don’t happen every day, so they do tend to attract a lot of attention.
Other technical factors
Other technical factors that have occurred in the market include Ethereum prices closing above the 50-day EMA, pictured in red, for the last several days. The market has also crossed the 200-day EMA, which, by its very definition, means we could be in an uptrend. Quite often, longer-term traders will use the 200-day EMA to determine the larger overall trend. Because of this, certain algorithms and systems will jump into the marketplace and start buying.
The market has also crossed above the psychologically significant $200 level, so that will attract a certain amount of attention by itself. With that and the moving averages starting to curl higher, there are plenty of traders out there looking to buy Ethereum as things stand.
Continued run from fiat currency
Central banks around the world continue to cut interest rates, which should work against the value of fiat currency in general. As long as that’s the case, cryptos should continue to attract a certain amount of order flow, as it is one of the favorite ways for traders to get away from Central Bank meddling. The interest rate cuts work against the value of fiat currency, and with the Federal Reserve jumping into the fray, the last stalwart of hawkish financial policy has fallen by the wayside. That should be good for all cryptos, Ethereum included.
While the last couple of years have been lackluster for cryptocurrency, we could be seeing the beginning of an overall move higher with most of these markets. This will include not only Bitcoin, but several of the alternative coins as well.
- Ethereum trading at large round figure
- 50-day EMA in focus
- Bullish session on Monday
The Ethereum markets rallied quite significantly during the trading session on Monday as markets opened up from the weekend. Crypto did fairly well as traders looked for safety after the drone attacks in Saudi Arabia, with alternative assets doing fairly well during the day. Beyond that, Ethereum managed to test a major, large, round, psychologically significant figure in the form of $200.
Technical analysis
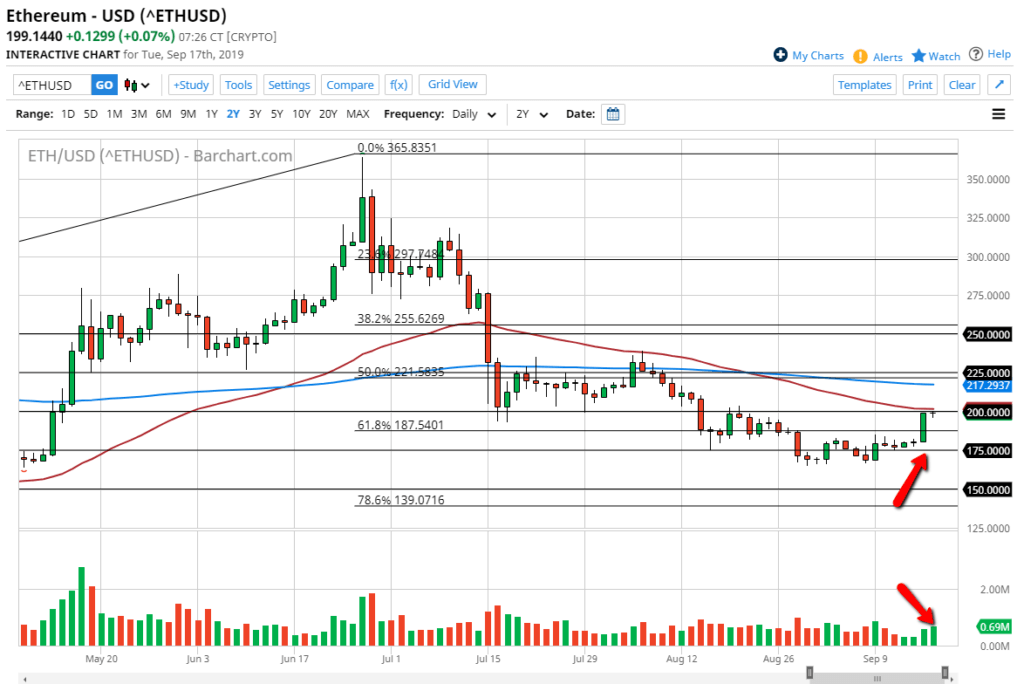
ETH/USD daily chart
The technical analysis in the Ethereum/USD pair is rather interesting currently, as we are testing several different factors at one time. The first thing that should be noted is that the volume picked up quite a bit on Monday as we shot towards the $200 level. This level in itself is crucial, because it has a certain amount of psychological importance to it, as well as structural resistance from about 30 days ago. As such, it’s not a huge surprise that the market stopped right at that level.
Further compounding that area as resistance, the 50-day EMA is flattening out just above that handle. It makes sense, then, that the market may stall in this general vicinity. However, if it were to clear the $200 level on an hourly close, that could be the beginning of a move towards the blue 200-day EMA closer to the $220 level.
Beyond all of that, the market looks as if it has just formed a so-called “rounded bottom”, which is a bullish reversal signal. A break above the $200 level with any substance at all would kick off that bullish signal, which measures for a move to the $230 level above. Beyond that, the Federal Reserve will have an interest rate announcement during the trading session on Wednesday. If the US dollar gets hit, it could send Ethereum up in terms of US dollars as well.
The trade going forward
The trade going forward is to simply look for pullbacks to take advantage of value. Buying breakouts also works as well. Longer-term, this is a market that looks as if it is trying to rally significantly, as Ethereum has some catching up to do when it comes to the trend versus Bitcoin, for example. After the Monday session, it’s obvious that there is still a significant amount of interest in this market – and, of course, significant demand.
As long as the market can stay above the $175 level, selling seems difficult, and it does appear that the market is trying to change the overall trend. This is definitely a currency pair worth watching as the Bitcoin market has already made a significant move over the last few months, while Ethereum has lagged. It is possible that some of the altcoins are going to attract attention going forward, which is going to be good for the entire crypto market in general.
- Ethereum continues to grind sideways
- Cryptocurrency at major support level
- Quiet conditions without momentum show confusion
- “Death cross”
Ethereum has curiously acted very much like the rest of the global financial markets over the last several days. It is simply going nowhere. Although not as volatile as other assets such as the stock market, Ethereum finds itself held hostage to very unclear economic conditions. At this point, it’s only a matter of time before we get some type of impulsive candlestick that we can trade. In the short term though, we have been forming a bit of a descending triangle. This suggests that we are going lower, but there is a multitude of technical analysis confluence around this area.
Technical analysis
The technical analysis for this market is all over the place. We are hanging about the 61.8% Fibonacci retracement level, which of course is an area that attracts a lot of attention. The so-called “golden ratio” attracts a lot of attention. Therefore, one would have to think that there are some buyers in this area. Beyond that, there is also the $175 level – which explains why we are starting to hold up as well, as Ethereum tends to move in $25 increments.
Looking at the moving averages, we have also seen the 50 day EMA cross below the 200 day EMA, forming the so-called “death cross” – something that is an omen of lower pricing for longer-term traders. That being said, quite often it is also formed at the very end of that move lower, as it is most certainly a lagging indicator.
Long-term investment
Looking at the long term for the chart, it’s very likely that we will probably continue to see a longer-term basing pattern, but that doesn’t mean we can’t break down. It seems as if we have another push lower, but then perhaps at that point we could start to see value hunting come back into play. The $150 level would be an area that would attract a lot of attention, and most certainly the $100 level would too. That being said, Ethereum can’t avoid the volatility that we see everywhere else. After all, you are trading Ethereum against the US dollar, which has been strengthening against almost everything else.
The alternate scenario is that we break above the $200 level, but the move higher would probably be very noisy. With that in mind, the easiest way to trade Ethereum right now is to simply buy-and-hold. It is historically cheap, based on the last couple of months, so one would assume that a certain amount of value as being attached to the market. That being said, you can probably take your time to build up a larger position, as we get the sudden volatile moves in crypto every once in a while. Looking at this chart, there is very likely going to be several violent moves as the rest of the financial world seems to be essentially on fire.

