

巴西雷亚尔
Video Transcription: Steps to Make a Profit from Bullish and Bearish Engulfing Patterns
Hello guys, top rated forex brokers here, and we move forward with an interesting strategy to trade. Bullish and bearish engulfing. As you can see on the screen we deal with candlestick techniques and candles, therefore, one of the most powerful candlestick techniques is the engulfing pattern.
(0.21) Before anything you have to imagine this one relates to the stock market. It was invented on the stock market. On the FX market, it worked for years, it still works, but you have to be very careful with the time frame.
(0.39) Because now, the Spread, or the difference between the bid and the ask price, let me show this to you on the MetaTrader. The difference between the bid and ask price is so small that the conditions for an engulfing pattern are not there anymore. Look at the US Dollar and Swiss franc, 97520 to 97527 which is 0.7 Pips. Look at the euro-US dollar. It is 0.3 Pips.
(1.06) It is difficult to create an engulfing pattern on a bigger time frame, because if you look at the weekly chart; so let’s go to the weekly; this is the US dollar and Canadian dollar. Let’s go to the end of it and zoom in.
(1.25) With a bullish engulfing pattern or a Bearish one, you need to have a difference between the opening candle and the closing one in such a way that it will engulf the previous one.
The pattern looks like this. With a Bullish engulfing, (starts to draw) you have the body of a candle, let’s say that this is a candle, and let’s make it red so that we know it is a bearish candle.
(1.56) And then of course a red candle, with a shadow somewhere around here. Let’s make the body of it bigger like this, so this would be a red candle. then the next candle that comes, which is this green one, should totally engulf the red one like this.(green candle on screen)
(2.23) It doesn’t matter the length of the shadow, what’s important is the two bodies here (circles them). This one totally eats into the previous one. For a bullish engulfing pattern like this one, you need a Bearish trend. And then the market, of course, reverses into a Bullish tsunami. The same is valid the other way round.
(2.51) At the top, you have what? At the top, you have a strong Bullish candle followed by an even stronger bearish candle, but a candle that completely engulfs and eats into the previous one. What do we need for a candle to engulf the previous one? A gap.
(3.14) Because if this is the closing of the previous candle. And the opening price of the other one should be a bit higher to totally engulf this one, because if the opening price is here (top right of green candle), then it will not engulf this one.
(3.32) An engulfing pattern is typically a subject for the stock market. Because, when the stock market opens every day there is a gap and therefore the pattern works nicely.
(3.44) But it works on the FX market as well, let me show it to you right here on this US dollar Canadian chart. At the top the 1.46 which is on the weekly chart. The market closed or dies.
(4.00) At the opening, and this is the opening price of the new candle, and you look here at the OHLC, and closing price on the OHLC is 1.4533 and then on the new candle the opening price is 4601 which is 48 pips difference.
(4.30) So the market gets high at the opening of the new week, and closes lower on the trip; totally engulfs the previous candle. Now that is as bearish as bearish can be.
(4.42) This is called a Bearish engulfing pattern, and it shows the start of a new trend. There are two approaches to trade the Bearish engulfing or the Bullish one. To simply measure the length of the stronger candle, then to wait for a pullback.
(5.08) Ideally, you will see a pullback come into its territory about 50% 61.8% but that is not mandatory, and you might end up missing the whole point. Aggressive traders that don’t want to lose such an opportunity will go short at the closing of the second candle.
(5.31) And we will use any opportunity here to ebb on the same position. To know or to have an idea what this means for the overall reversal pattern, then the bigger the timeframe here, the more powerful the reversal will be.
(5.50) In this case, It’s a weekly chart, so if you zoom out and look at the market. So after the Bearish pattern here, imagine you go short here.
(5.59) Stop loss at the highs, even if it is on the weekly chart, the stop loss on the highs would invalidate the pattern, and you still have a risk-reward ratio of 1 to 2 or 1 to 3 for a US dollar pair, and that is quite something.
(6.20) From two simple candles, this is how Bullish and Bearish engulfing work. On the lower time frame it is very difficult, because rarely the market gaps on the hourly chart, for example, when the new candle opens, you have got to be careful with these patterns. Use them from the daily chart and the bar. These are beautiful patterns, so let’s move on to the next video.
前面两篇文章主要阐述了单烛台模式的日本蜡烛图形态,本文则介绍三烛台模式,即星形。星形是恰好在趋势末尾形成的强势反转形态。一个星形由三根蜡烛线组成,第一根为之前趋势,中间像十字蜡烛,最后一根开始新趋势。根据星形出现的位置,可以分成两种星形类型,其解释相同。这些形态十分强大,可从中发现后续强劲趋势。
反转形态的星形类型
由于出现在趋势末端,所以分为看涨或看跌反转形态。看涨反转形态称为晨星,看跌反转形态则称为暮星。
晨星概述
晨星是一种底部反转形态。其预示价格即将上行的事实造就了这个名字。就像水星一样,它的出现代表太阳即将升起。晨星形态由三根蜡烛线组成:
- 第一根是大红烛线。
- 中间是小十字线或锤头线。
- 第三根是反向大绿烛线。
如上文所述,中间蜡烛线本身为反转形态,这点我们在往期日本蜡烛图技术专题文章中有述。此形态交易直接了当,就像我们设置锤头线或上吊线形态交易计划时一样简单。原理也是一样的:跟随晨星买入之前,等待市场小幅回撤到构成该形态的第三根蜡烛线区域。这样能让交易者在较好点位进入,补偿后续更优风险/回报比率。风险/回报比率应最低为 1:3,多头交易的止损点应当设在晨星的最低点。通常,该点由星形中间蜡烛线给出。反转形态也是多头和空头之间艰难角逐的战场,此时由空头主导市场。因而在即将形成的新趋势方向做多之前,等待回调才是正常的。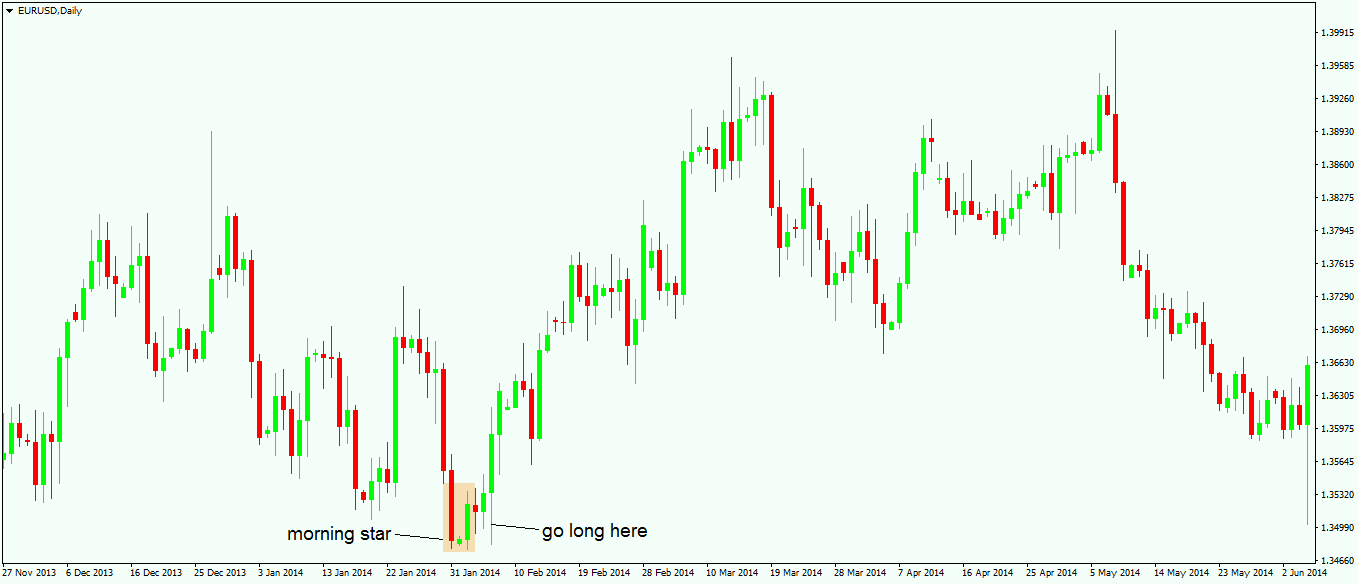
上图是一张欧元/美元货币对日线图上形成的晨星,其遵循上文所述形态的所有规则。该形态的低点不在中间蜡烛线,但并非一定如此。如果交易者等待回撤,在多头侧进入更好,容易实现风险/回报比率。
暮星交易
和晨星一样,暮星以金星命名,而金星在日落前显现。顾名思义,暮星是一种顶部反转的看跌形态,预示未来价格走低。晨星和暮星的第一根与第二根蜡烛线之间均应存在空隙。但鉴于外汇市场的连续性,并非一定如此。就像十字线中开盘价和收盘价相同的可能性极低一样,此时对于前述两根蜡烛之间的空隙同样如此。和晨星一样,暮星也由三根蜡烛线组成:
- 第一根为绿色看涨蜡烛线。
- 第二根为十字蜡烛线或上吊线,有时看似这两者的混合。
- 第三根为看跌大红烛线。
根据实际经验,该形态中第三根蜡烛线的长度超出第一根蜡烛线越多,则形成新趋势的概率越大,晨星和暮星这两种形态均如此。第三根蜡烛线的长度必须至少是第一根的 50%。
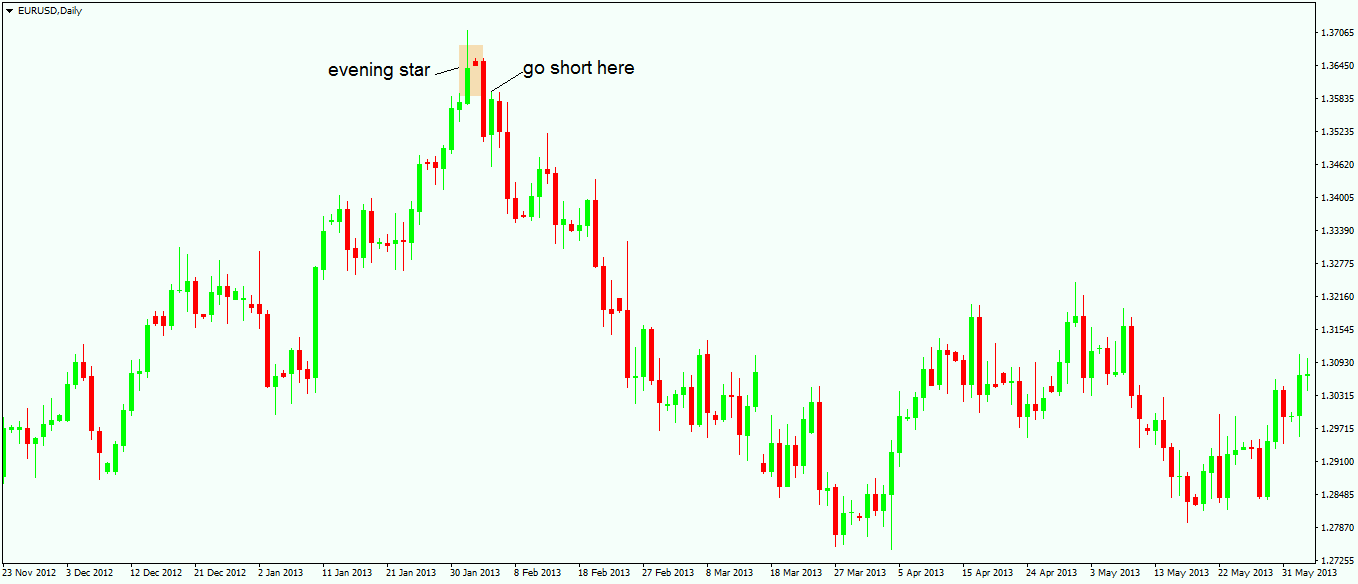
上图给出了暮星形态,最高点位于第一根蜡烛线,但第三根蜡烛线的长度接近第一根的两倍。这是后市看跌趋势来势凶猛的有力前奏。尽管如此,如果交易者希望在最佳点位进入,则暮星交易仍需等待小幅回撤到第三根蜡烛线区域。回撤位至少是第三根蜡烛线的 38.2%。注意,回撤不一定会发生。部分强劲的晨星和暮星后市无任何回撤,但第三根蜡烛线后做多或做空的风险太大,不容忽视。
区分晨星和暮星时还要看中间的蜡烛线。如果是十字线或像十字蜡烛线,则该形态比其他形态更强势。总之,晨星和暮星是强势且重要的反转形态,尤其是放在月线图或周线图等较长时间范围内看时。这时应运用同样的交易规则。但是,因形态形成的时间范围更广,风险/回报比率会带来较好收益。外汇交易学院最后一篇日本蜡烛图技术的专题文章将阐述让许多交易者困惑的一个概念:吞噬形态与穿刺形态的区别。二者十分相似,但仍需加以区分。
Best and most trusted forex brokers in 2024
Other educational materials
- How to Use Parabolic SAR to Buy Dips or Sell Spikes
- Bollinger Bands – Profit from One of the Best Trend Indicators
- Price and Time – The Holy Grail in Trading
- Two Ways to Use Gaps When Trading Forex Markets
- Trade Forex with Fibonacci Retracement Tool
- Trade with Risk-Reward Ratios
Recommended further readings
- “What You Don’t Know About Candlesticks.” Bulkowski, Thomas N. Technical Analysis of (2011).
- BINDABLE CANDLESTICK CHART COMPONENT. Utomo, V. G. (2012). Jurnal Teknologi Informasi dan Komunikasi, 2(1), 35-40.