

إعداد الرسوم البيانية في منصة MetaTrader 4
Video Transcription: How to Set up a Chart in Metatrader
Hello there, this is Topratedforexbrokers.com here, and we continue our trading academy with a new concept regarding the charts and the MetaTrader. You know what the MetaTrader is? It’s the most popular trading platform when it comes to retail trading. And today we will discuss the particulars of a chart of a currency pair.
(0.25) First of all, you must pick a currency from this MarketWatch here. And it doesn’t matter what that currency is, as the steps that we will discuss here will be valid for both the Metatrader 4 and Metatrader 5.
(0.43) So, for example, let’s choose USD / Japanese Yen. We can either click and drag a currency pair on an actual chart that is already in front of us, like this, and then you will have the USD/Japanese Yen on the screen, or, right-click, and we go for chart window and a new chart window here will open with the desired currency.
(1.11) If we want to have more space for analysis, we can close the market watch from here. You can easily open it and close it just by selecting it, and now the chart is showing across the screen. Let’s repeat the steps that we discussed in the previous video. Right click properties and go to the ‘colours’ and go either “bar up” where a bullish move is usually associated with the colour green, but you can actually set up the colours however you like.
(1.49) ”Bar down” or a bearish move is shown in red, so a bull candle should be green, bearish candles should be red. You can choose any kind of background that you want. Let’s choose white and go with a black foreground so that we can see the data and the levels of the currency pair. And then we go onto the current, and you have three options for a chart.
(2.21) By default you will have a bar chart, what does this mean? Let’s zoom in. These are not candles; these are bars. This is an old classic technical analysis as it appeared for the first time in the western part of the world. Technical analysis was invented when people looked for pairs to interpret future price movements over security which was typical of the stock market back then.
(2.50) They used bar charts, and you have the option to use the bar charts here. Or they used line charts and looked at the lines. This is a line that simply coincides with the closing price during the trading day, and it depends very much on the timeframe. This is the hourly chart.
(3.11) So for every hour, you have the closing price, 1 hour, 1 hour, 1 hour and so on, so this is a line chart. Unfortunately, the line chart does not give you the shadows of a candle, and it doesn’t give you the highest point in a candle or the lowest point in a candle.
(3.33) You only end up with the closing price. In the Forex market, this may be tricky, In the sense that, if you put a stop loss here, let’s just say that the market came and spiked at 112.50 coming back and closing the candle and you won’t see that move here in a line chart. But on a candlestick chart, you can see that move, and it is more realistic.
(3.58) So bar charts were the first approach to technical analysis, and a bar chart is very simple to explain. Namely from where the previous bar ends, here, the next one opens, and then you have the highest point, then the lowest point and then the close.
(4.19) And then it starts with the opening, the highest or at the lowest point, the close. The chart connects the previous closing price with the actual opening price of the candle. But the Japanese approach became famous in the Western World, and Westerners embraced the Japanese candlesticks as they are very powerful.
(4.44) We have plenty of examples of Japanese candles here on our trading academy, especially reversal patterns which form and they are quite easy to spot.
(5.01) Anyways, between the three options that we have here; a candlestick chart, a bar or a line chart on the MetaTrader, candlestick charts are the most popular or most used charts among retail traders, so we will use the candlestick charts.
(5.19) Let’s go back to properties, and then on to the colours, let’s say we go back and choose white for the background and black for the foreground. Bar up, green and bar down, red, bull candle we choose green, bear candle, choose red, so we have all the colours set up again.
(5.44) And on the common we have the chart shift. We want the chart to shift so that we have room here for analysis, and we can just have candlesticks and no OHLC as we explained in the previous analysis. No grid and if we click ok the chart will appear in front of us.
(6.04) If we take a look here, we have a small arrow here on top of the screen (points to arrow), now this small arrow, if you click on it, and drag, then a vertical line appears. Using it, we can shift the chart back to halfway across the screen. This will create all this room here for analysis. What kind of analysis?
(6.27) Drawing a trend line for example, further in time, And then maybe if we have a trend line of a triangle, then maybe the market broke the trend line, comes story tests, and it gives you future support and so on. I am just giving you ideas on how to use the space on the right-hand side.
(6.50) Let us assume that we have set up such a chart for the US Dollar/ Japanese Yen, and then we want to interpret this kind of bullish flag for the pair, keep in mind that everything we do on the MetaTrader, any setup that you make on the MetaTrader won’t save automatically. It will ONLY save when you close the trading platform. So you must close the trading platform.
(7.20) Open it again, and your work is saved. Right now, let’s say something happened like the power goes off. Or the trading platform gets blocked, or there is a problem with the internet etc. then your work won’t be saved. You have got to be very careful to save it, so you should close the platform from time to time. Especially when you set the parameters for your charts.
(7.53) Here you have the hourly chart for the USD/Japanese yen, but as you see, we can easily it is to switch to the four-hour chart or switch to the daily chart, the daily prospective. And so on. But we do not want to repeat the process that we described here.
(8.13) We don’t want to repeat these steps every time. If we open a new chart, “File” “New Chart” and choose USD/Swiss Franc, we do not want to go back to properties, and so on, we can easily save the work that we have done, as a template, and then we use this template for any currency pair.
(8.36) Timeframe we want in the future. Right-click, template, save “template”. So we go with this template. Topratedforexbrokers and then we save. And we open a new chart or the one that we have open, for example, the USD/ Swiss Franc and then we right-click, template, and then we simply choose the template here which is topratedforexbrokers and then the chart appears in front of us.
(9.16) There is another trick, whenever the chart opens somewhere, and you want to jump quickly to the end of it, you simply hit the END key on your keyboard, and it will take you to the end. Or if you want to go to the left side of your screen, to back-test a strategy, you simply click on the home button
(9.41) Then it shows values, in this case from 2007 in the hourly chart and you can analyze what the US Dollar/Swiss franc did and so on. The moment that you close the trading platform on the MetaTrader. Your work is saved.
(9.59) This is how you setup a chart on the MetaTrader and the next video will continue with the types of orders that we can place on the MetaTrader.
يتناول التحليل الفني تفسير الأسعار / الأنماط التاريخية بهدف التنبؤ بأنماط الأسعار المستقبلية على الجانب الأيمن من الرسم البياني،
ثمة نظريات تداول تتطلب تحليلاً عميقًا للأسعار التاريخية حتى يتسنى للمتداول التوصل إلى إطار زمني يمكن استخدامه بالفعل للتداول.
وتأتي ضمن أمثلة تلك النظريات نظرية موجات إليوت، كما أن معرفة كيفية إعداد رسم بياني في منصة MetaTrader سيساعد بالتأكيد على أتمتة الأطر الزمنية.
يستخدم المتداولون الآخرون مؤشرات فنية مختلفة مثل مؤشرات الاتجاه أو مؤشرات التذبذب عند الدخول / الخروج من الصفقة،
وكي يتسنى تنفيذ هذا في منصة MetaTrader، فثمة أشياء أساسية يتعين على المتداول معرفتها.
ضبط المنصة
عند فتح رسم بياني مضبوطًا وفقًا للإعدادات الافتراضية التي تقدمها منصة MetaTrader، فيكون حينئذ شبيهًا بالصورة التالية.
وهي ليست مفيدة بالفعل لأغراض التداول، فضلاً عن المساعدة في إعداد رسم بياني لطريقتك عند تداول الفوركس.
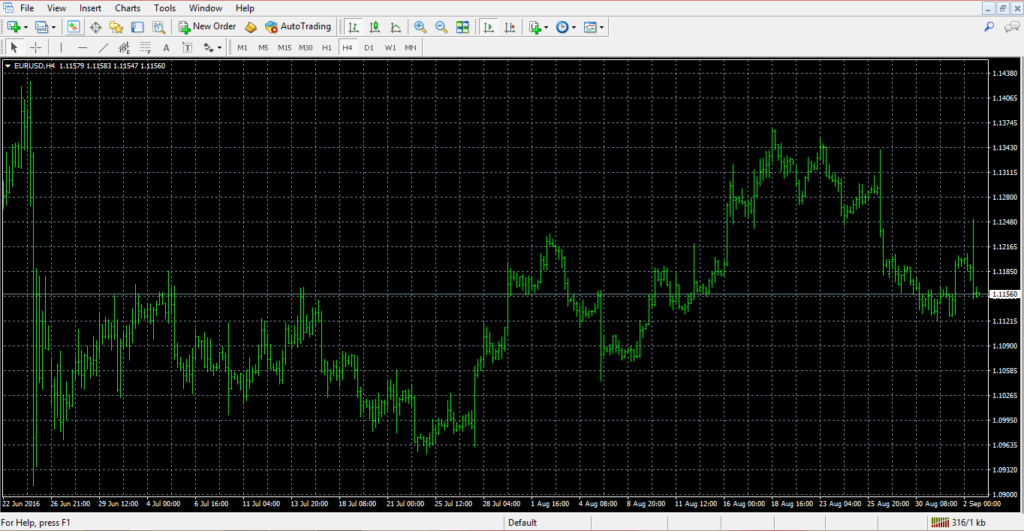
ثمة بضع أمور يتعين عليك تنفيذها بخصوص ذلك الرسم البياني، وأولها اختيار نوع الرسم البياني الذي تريد استخدامه: شمعات أو رسم شريطي أو خطي
Best and most trusted forex brokers in 2024
يُوصى بقوة باستخدام مخطط شمعات نظرًا لأنه يتسنى تطبيق تقنيات الشمعات اليابانية على قمة الأسعار الفعلية.
يمكن الاطلاع على الخيارات الثلاثة المتاحة لاختيار نمط الرسم البياني في الشطر العلوي من منصة MetaTrader، في المنتصف تمامًا.
وبعد اختيار مخطط الشمعات، يتعين علينا حينئذ معرفة كيفية التمييز بين الشمعات، أي معرفة متى يتحرك السعر في اتجاه صعودي، ومتى يتحرك في اتجاه هبوطي.
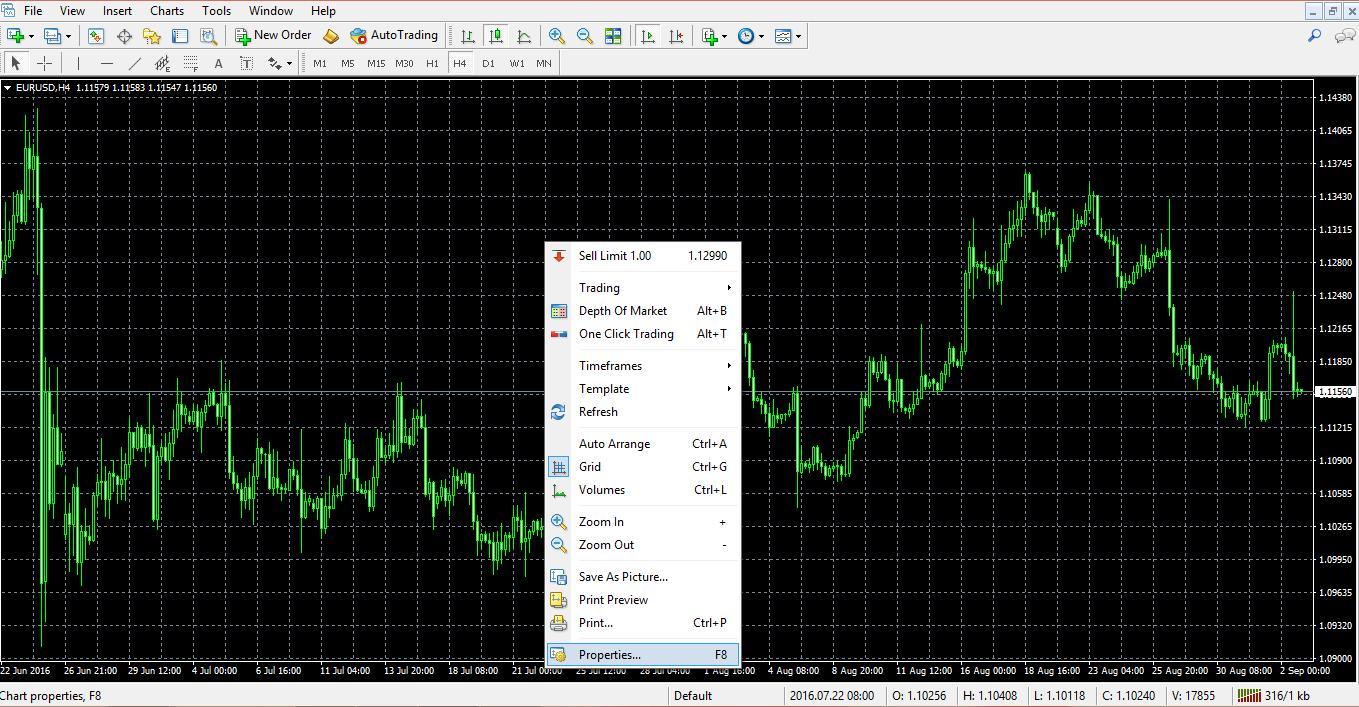
يُوصى باستخدام الخطوات التالية:
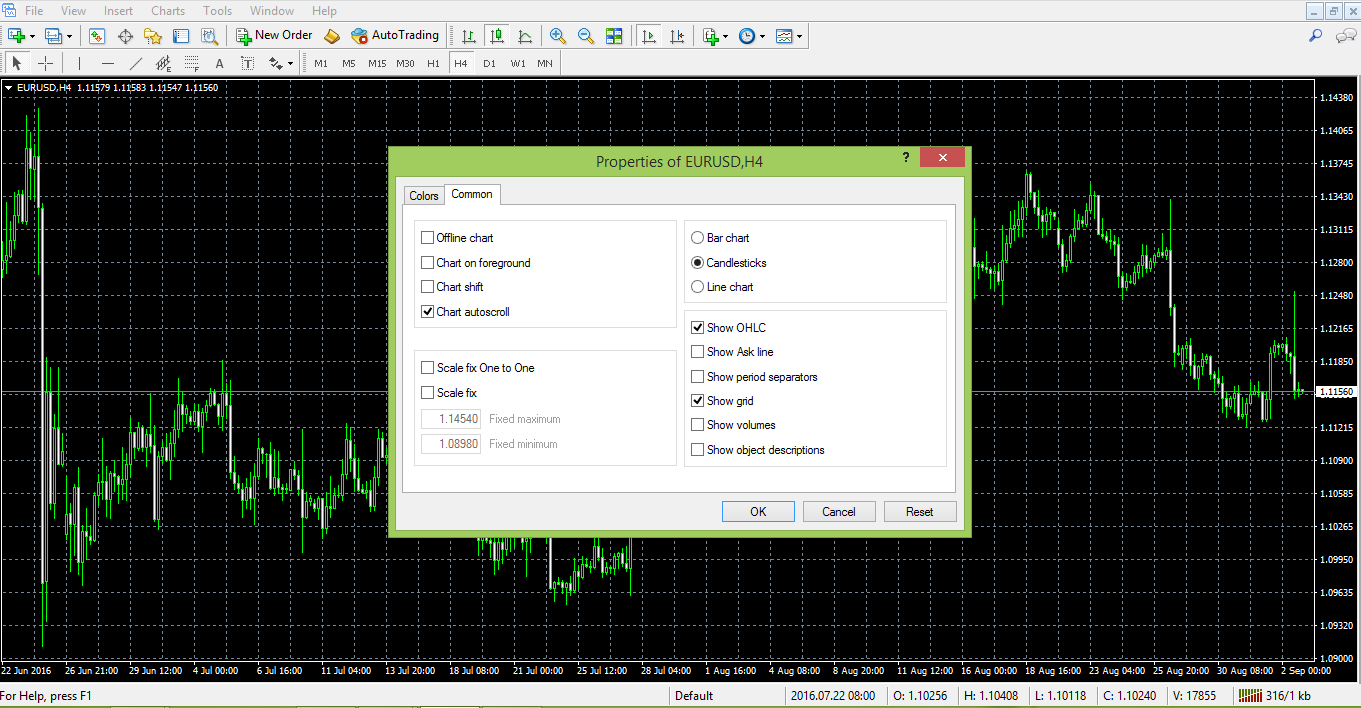
- انقر بزر الماوس الأيمن على الرسم البياني واختر “الخصائص”.
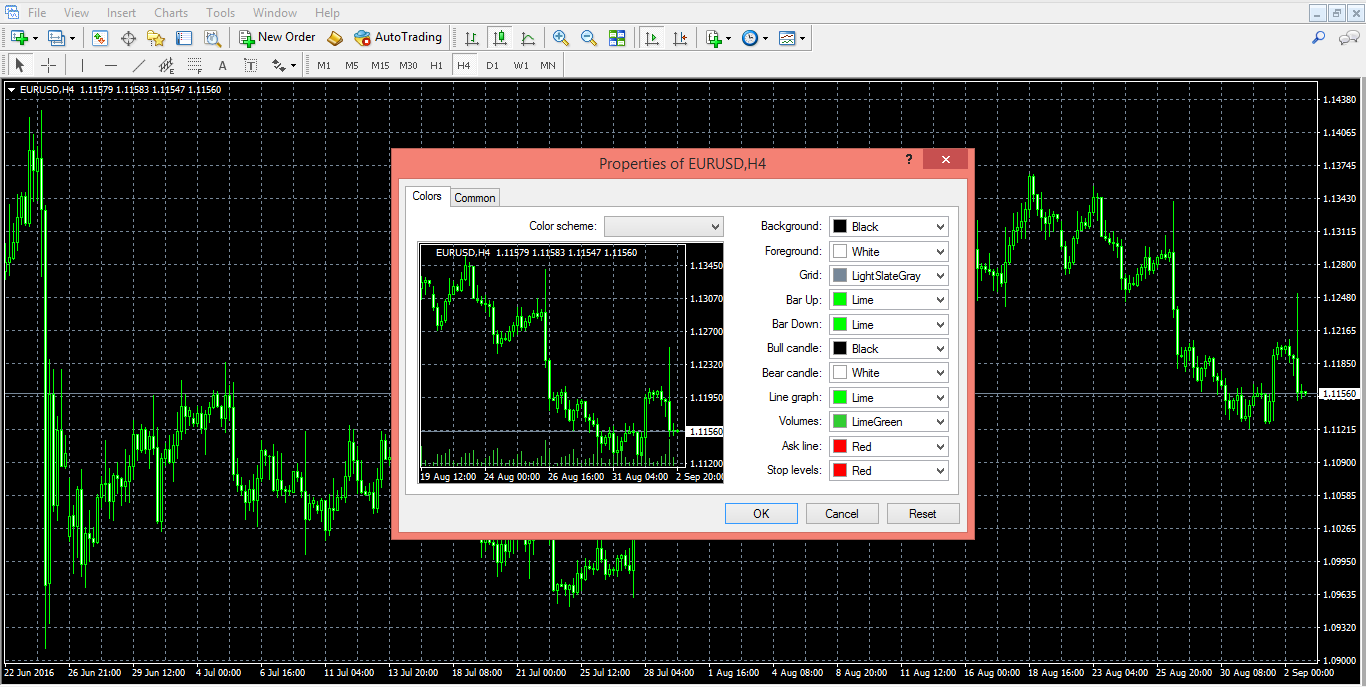
تنفتح علامة تبويب “الألوان” أولاً، ويمكن حينئذ اختيار الألوان المنشودة لكافة الأشياء الأساسية التي تظهر على الرسم البياني الآن.
اللون الافتراضي للخلفية هو اللون الأسود، وسوف نتركه دون تغيير في الوقت الراهن، ولكن تجدر الإشارة إلى أنه يمكن تغييره إلى أي لون آخر،
يتم تمثيل المقدمة من خلال مستويات الأسعار على الجانب الأيمن من الشاشة، في حين يكون العنصر الزمني على الجانب الأفقي السفلي بالرسم البياني.
ويجب أن يكون لون المقدمة مختلفًا عن اللون المستخدم للخلفية، وإلا فلن تكون المعلومات واضحة ولن يتسنى رؤيتها.
وفي هذه الحالة، نلتزم باللون الأبيض.
- تتكون الشبكة من خلال المربعات الصغيرة التي تنقسم إليها الشاشة، وبعد ذلك سيكون لدينا خيار التخلص منها أن أردنا ذلك،
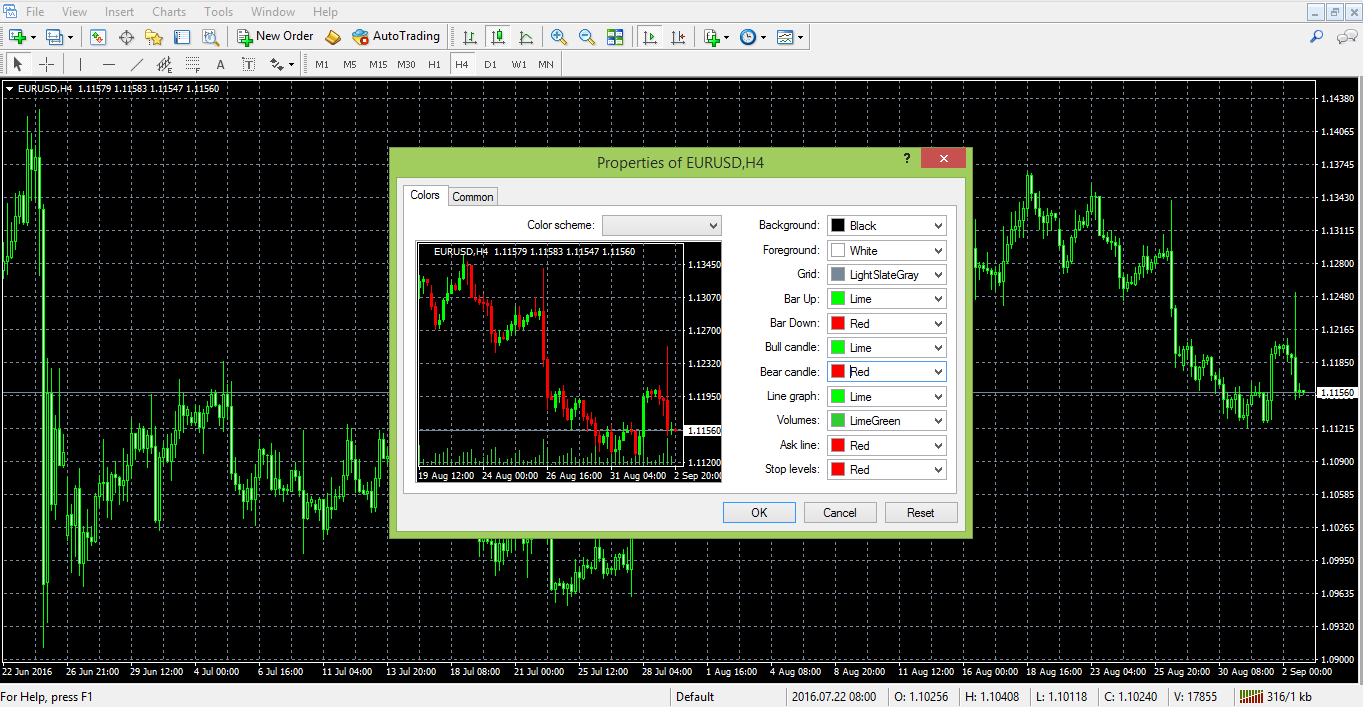
ويمكن حينئذ تغيير لونها إذا ما أردنا استخدام هذا الخيار. - يُمثل الشريط العلوي والشريط السفلي والشمعة الصاعدة والشمعة الهابطة الخيارات المتاحة لدينا لتلوين الشمعات،
ويكون اللون الأحمر هو اللون التقليدي للشمعة الهابطة، في حين يشير اللون الأخضر دومًا إلى أن الشمعة في اتجاه صعودي. - لا تحظى باقي الخطوط بأهمية عند إعداد رسم بياني، وقد حان الوقت الآن للانتقال إلى علامة التبويب المشتركة من الجزء الأيسر العلوي بعلامة التبويب “الخصائص”.
وكما يمكن أن ترى هنا، يكون خيار التمرير التلقائي للرسم البياني هو الخيار الافتراضي، غير أننا لا نرغب في أن يكون لدينا رسم بياني يسحبك دومًا إلى الأسعار الحالية.
يتضمن التحليل الفني نظرة إلى الماضي، ويتسنى لك إجراء هذا من خلال اختيار خيار نقل الرسم البياني والتخلص من خيار التمرير التلقائي للرسم البياني. - ومع اختيار عدم إظهار الشبكة، يظهر الرسم البياني بهذا الشكل.
حفظ قالب
الخطوة التالية التي يتعين عليك القيام بها هي أتمتة هذه العملية كي لا تضطر إلى تكرارها في كل مرة تفتح فيها رسم بياني جديد،
ويتسنى لك هذا من خلال حفظ الرسم البياني كقالب.
يمكنك حفظ الرسم البياني كقالب من خلال النقر بزر الماوس الأيمن على الرسم البياني واختيار علامة التبويب “قالب”،
ثم اختيار “حفظ قالب”، وتسميته، ولا شيء سوى هذا.
ومن هذه اللحظة، يمكن استخدام هذا القالب من خلال تحميله في كل مرة تفتح فيها رسم بياني جديد لأي زوج عملات أو لزوج العملات نفسه ولكن مع اختيار إطار زمني جديد.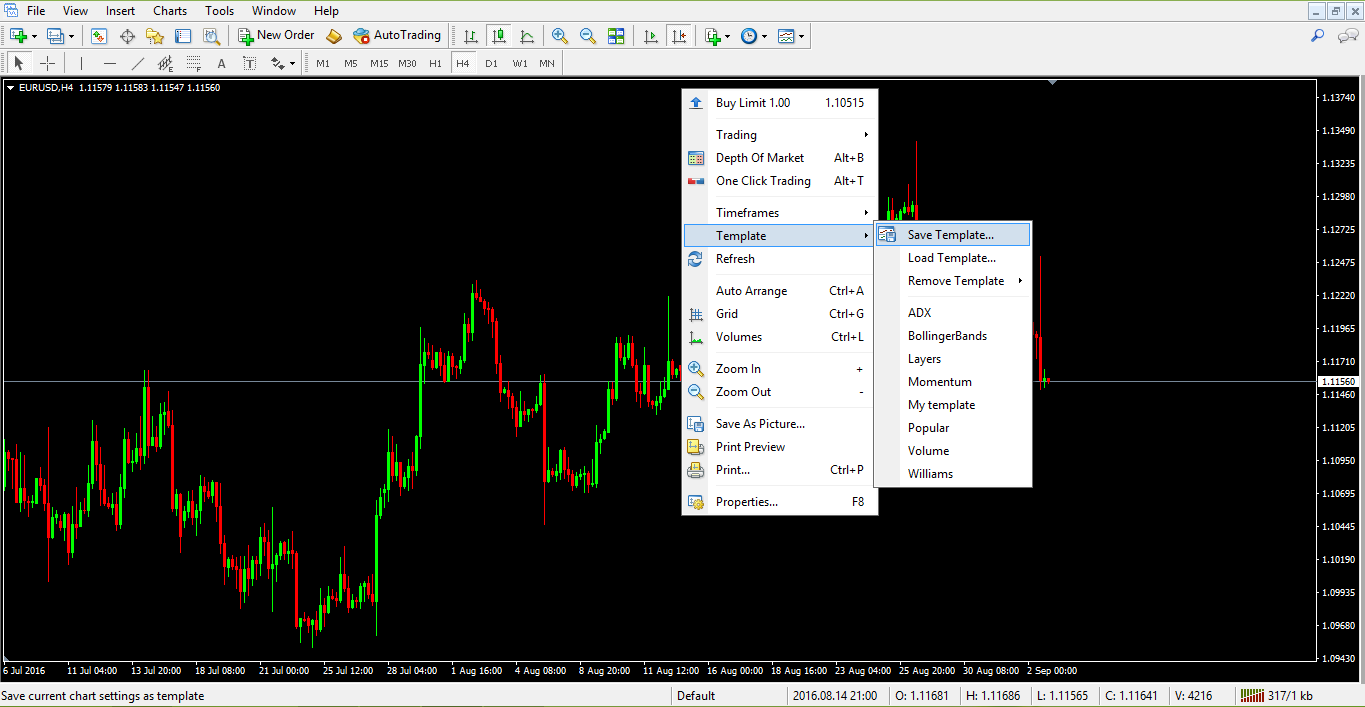
حفظ ملف تعريفي
يمكن بدء تشغيل التحليل الفني بعد حفظ القالب، كما يمكن تنفيذ أشياء مختلفة على الرسم البياني اعتمادًا على نوع التحليل الفني المستخدم.
يستخدم مستخدمو موجات إليوت هذه النظرية لإحصاء الموجات بشكل فعال، ومن ثم سيظهر الرسم البياني للتداول وكأنه يحتوي على عدد كبير من الأرقام والحروف.
ينظر المتداولون إلى هذه الأرقام والحروف لتفسير إذا ما كان السوق يقوم بحركة مندفعة أو حركة تصحيحية، حيث تتكون حركة السعر، وفقًا لإليوت، من خمس موجات مصححة بثلاث موجات أخرى.
تُستخدم الأعداد لإحصاء الموجات المندفعة، أو الموجات الخمسة، في حين تُستخدم الحروف لإحصاء الموجات التصحيحية.
يستخدم المتداولون الآخرون مؤشرات الاتجاه (تُطبق هذه المؤشرات على الشمعات الفعلية التي يمكن رؤيتها على الرسم البياني) أو مؤشرات التذبذب (مؤشر تذبذب ينطبق دومًا على الجزء السفلي من الرسم البياني وليس على الشمعات الفعلية) لاكتشاف أماكن لدخول السوق أو الخروج منه.
كما يمكن أيضًا استخدام هندسة السوق، ويتضمن هذا مجموعة كبيرة من الخطوط والقنوات التي تبدأ من الأسعار الأقدم وتظهر على الجانب الأيمن بالرسم البياني لاكتشاف مستويات الدعم والمقاومة والتي تحظى بأهمية كبيرة ويمكن استخدامها عند التداول.
وبغض النظر عن أسلوب التداول ونوع التحليل الفني المستخدم على الرسم البياني، يتسنى للشخص في أي وقت حفظ هذا باسم ملف تعريفي.
وجدير بالذكر أن إغلاق منصة MetaTrader يشير إلى حفظ العمل المنجز والملف التعريفي تلقائيًا، وستجد كافة الأعمال المنجزة عند فتحها ثانية.
يمكن الحصول على ملف تعريفي وتحميله على حساب آخر بمنصة MetaTrader بكل سهولة، وهذا أحد الأمور الرائعة التي تميز هذه المنصة.
تجدر الإشارة إلى أن الفقرات الواردة مسبقًا ما هي إلا معلومات أساسية عن كيفية إعداد رسم بياني في منصة MetaTrader، وكيفية استخدام الجزء الخاص بالرسم البياني لتحليل السوق.
ولا يتسنى لك التحقق من الأسباب التي تجعل منصة MetaTrader أفضل منصة تداول في العالم لمتداولي التجزئة إلا من خلال العمل الجاد ومحاولة الوصول بنفسك إلى بعض النصائح والحيل بخصوص هذه المنصة.
Other educational materials
- Forex Trading Accounts and the Value of a Pip
- The Importance of Swap and Spreads
- How to Enter/Exit a Trade
- How Do I Make a Profit from Forex Trading?
- Forex Market Terminology
- Profit from Forex Trading Using Different Trading Styles
Recommended further reading
- Testing for arbitrage opportunities within the foreign exchange market. Hussain, I. (2009).
- “INNOVATE ONLINE TRADING BY ADDING SOFTWARE BRIDGE: IDEA AND IMPLEMENTATION.” (2014). Qureshi, Muhammad.