Should you choose to use MetaTrader 4 when trading forex, setting up a chart is one of the first tasks you’ll encounter. Unfortunately, although MT4 is the most popular forex trading platform in the world, this isn’t the easiest of tasks.
It’s easy to feel overwhelmed upon firing up MetaTrader 4. The software can seem complicated to begin with but luckily, we’re here to help. Our experts have created a complete guide to setting up MetaTrader 4. On this page you can learn:
- How to change the format of your chart in MT4
- How to personalize the MetaTrader 4 color scheme
- How to create a profile and save various chart templates
- The best forex brokers to trade with when using MetaTrader 4
Why use MetaTrader 4 for forex trading?
Before you go about learning how to set up a chart in MetaTrader 4, you’re probably wondering what makes this platform so much better than its competitors.
MetaTrader 4 is the most well-respected and widely used forex trading platform there is. Hundreds of top forex traders use the platform on a daily basis, and almost all of the best forex brokers will allow you to trade using the software.
Metatrader 4’s popularity and ubiquity are only part of its appeal. The platform has enjoyed such success as it offers you many other advantages too, including:
- A professional, clear interface which allows you to watch your trades with ease
- Highly customizable
- Supports three execution modes, various order requests and stop/profit loss orders
- Downloadable software means it’s unsusceptible to glitches or browser issues
- Available to both Mac and Windows users
- Offers a fully functional mobile app counterpart, which is available on both iOS and Android devices
- Uses a lower amount of memory (RAM) than other popular trading platforms
Another huge benefit of using MetaTrader 4 is that it’s the best platform for conducting technical analysis. Technical analysis refers to interpreting historical prices/patterns, to help in forecasting future price patterns.
Many technical analysis trading theories require a deep analysis of historical prices until the trader can come up to a time frame that can actually be used for trading. Knowing how to set up a chart in MetaTrader will certainly help to automate the time frames.
You may also wish to use technical indicators such as trend indicators or oscillators when entering/exiting a trade. In order to do that in MetaTrader, there are some basic things you need to get to grips with first.
Step by step guide to MT4 chart setup
First things first, if you haven’t already, you will need to download the MT4 software. This can be done from the official MetaTrader website or via your broker of choice. Once the download is complete, you’ll then need to login to your trading account.
If you want to simply explore MetaTrader 4, you can choose to open up the software using a demo account. This is a great way to practice setting up charts so that you’re well prepared for when you want to start trading with real money.
Change the Chart Style
When you first load up MT4, the chart you are presented with will look like the image above. This is a chart which is using the default settings of MetaTrader, however, these setting aren’t really helpful for trading purposes, nor are they visually appealing.
There are a number of things to do with such a chart, and the first is to choose what type of chart you want it to be. In MT4, you can choose between a candlestick chart, a bar chart or a line chart. You can change the chart style by selecting the relevant icon in the top toolbar of the MetaTrader platform (in the middle, next to the zoom in/zoom out icons).
In our opinion, the candlestick chart style is best. Forex candle charts are the most commonly by forex traders and having a matching style can help you to understand theories and techniques.
Change the Chart Color Scheme

After choosing a candlestick chart, you need to differentiate those candles, so that you can see when a price has moved to the upside and when it’s moved to the downside. To do so, follow these steps:
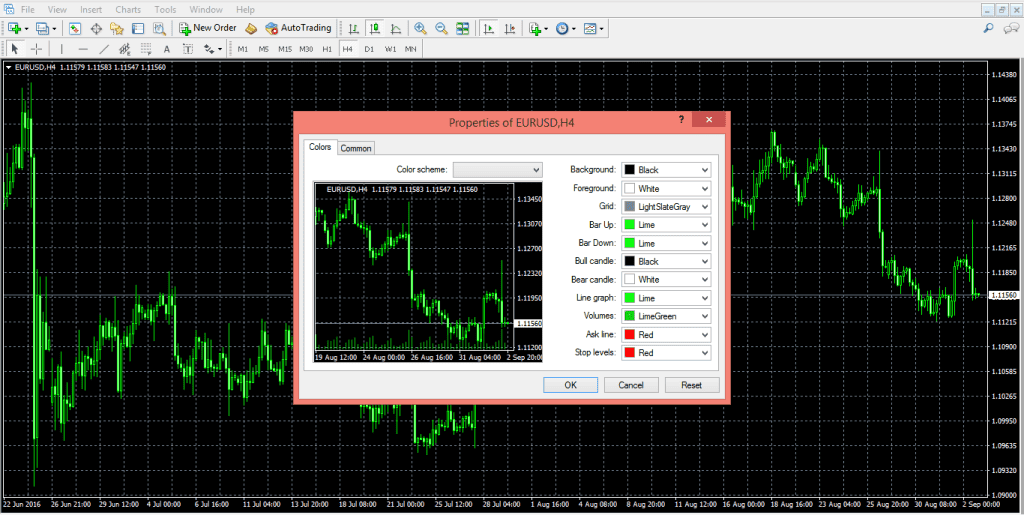
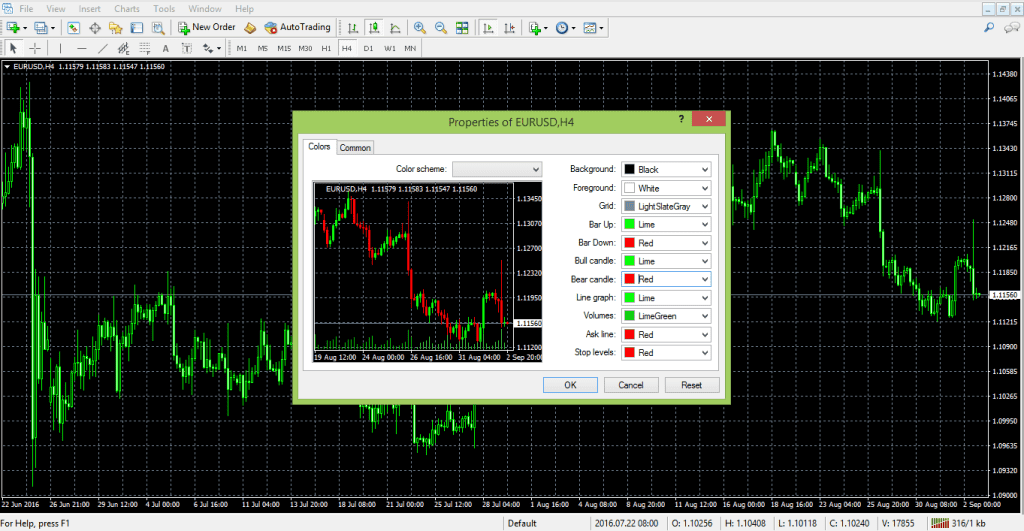
- Right-click on the chart and choose Properties.
- Under the Colors tab, you can choose the desired colors for all basic things that appear on the chart right now. Here you can change:
- The background color. By default, this is black, but many traders prefer a white background.
- This foreground color. This must be different from the one used for the background, as otherwise the information will not be seen.
- The grid color.
- The Bar Up/Bar Down and Bull Candle/Bear Candle colors. These represent the options we have for coloring the candles. The conventional color for a bearish or down candle is red, while green always shows a candle that is moving to the upside. You can select whichever colors you like, but do remember that contrasting colors will make the chart easier to read.
Gridlines and Other Options
Once you’ve changed your chart style and color scheme, you may wish to remove the gridlines from the chart. The grid in the background of the chart is not very important, and it can overcomplicate the appearance, making it harder to read. Chart shift option instead.
Saving a Template
Once you have your graph looking the way you want it to, the next thing to do is to automate this process in order not to be forced to repeat it every time we open a new chart.
The way to do this is to save the chart as a template. To do that, right-click on the chart and choose the Template tab. From there, click Save Template and give it a name.
From this moment on, every time a new chart is opened on any currency pair, or on the same currency pair but on a different time frame, this template can be used by loading it.
Saving a Profile
After having saved a template, technical analysis can start. Depending on the type of technical analysis you decide to carry out, different things change within the MetaTrader chart.
- Elliott Waves theory – This theory effectively counts the waves within price movements, and so your trading chart will look like it has a lot of numbers and letters on it. With this type of analysis, you are looking to interpret whether the market is making an impulsive move or a corrective one, as according to Elliott, price action consists of five waves corrected with another three. Numbers are used to count impulsive waves, or the five waves, while letters are used to count corrective waves.
- Trend indicators – Trend indicators may be applied to the actual candles that can be seen on the chart, or as a line/bar graph in the background. These help you to predict which way the chart may move next.
- Oscillators – Oscillators are always applied to the bottom of the chart and not on the actual candles. They show you the best places to enter or exit a market.
- Market geometry – This implies a lot of lines and channels that start from older prices and which are projected on the right side of the chart to find out support and resistance levels, which are important and can be used when trading.
No matter what the trading style and the type of technical analysis used on a chart, at any one moment of time one can save this as a Profile. Closing the MetaTrader platform means that the work and profile are automatically saved, and by opening it again all the work will be there.
A profile can be taken and uploaded on another MetaTrader account very easily too which is one of the great things about this trading platform.
The best brokers with MetaTrader 4
Now you know how to set up charts in MetaTrader 4, you’re probably keen to explore the software and to start carrying out your own technical analysis. To do this you will need to register with a broker for a trading account.
If you haven’t done this yet, don’t worry, we’ve got you covered. Below, our experts have compared the best brokers to use MT4 with and highlighted the key benefits of each, so that you can select one which suits your needs.
Cryptocurrency Trading
Crypto CFD pairs
Min Deposit: $100
Low trading fees
Negative balance protection
Min Deposit: $5
Cryptocurrency Trading
Crypto CFD pairs
Min Deposit: $100
FAQs
There is no ‘best’ MetaTrader 4 chart setup, it all depends on your trading style, your analysis style, and your visual preferences. However, we do recommend that beginner traders set up the platform to show candlestick charts. This is because most experts use these, and so it will be easier to follow tutorials if yours looks the same.
To save a template on MetaTrader 4, you simply need to right-click on the chart and select Template. Then, give the template a name and then click Save Template. If you want this template to be used each time you open a new chart, name the template ‘Default’.
If you wish to reset the entire MetaTrader 4 platform back to default settings, you will need to re-install the software on your device. If you simply wish to restore a chart on MT4 to its default appearance, however, you can simply right-click on the chart and select Properties. From here, you need to go into the Common tab and click on the Reset button.
To change the background color of a chart in MT4, you need to right-click on the chart and select Properties. From here, you will be presented with a range of color options, each relating to a different element of the chart. You can change the color of each element, including the background, by selecting a new color from the drop-down menu.
Video Transcription: How to Set up a Chart in Metatrader
Hello there, this is Topratedforexbrokers.com here, and we continue our trading academy with a new concept regarding the charts and the MetaTrader. You know what the MetaTrader is? It’s the most popular trading platform when it comes to retail trading. And today we will discuss the particulars of a chart of a currency pair.
(0.25) First of all, you must pick a currency from this MarketWatch here. And it doesn’t matter what that currency is, as the steps that we will discuss here will be valid for both the Metatrader 4 and Metatrader 5.
(0.43) So, for example, let’s choose USD / Japanese Yen. We can either click and drag a currency pair on an actual chart that is already in front of us, like this, and then you will have the USD/Japanese Yen on the screen, or, right-click, and we go for chart window and a new chart window here will open with the desired currency.
(1.11) If we want to have more space for analysis, we can close the market watch from here. You can easily open it and close it just by selecting it, and now the chart is showing across the screen. Let’s repeat the steps that we discussed in the previous video. Right click properties and go to the ‘colours’ and go either “bar up” where a bullish move is usually associated with the colour green, but you can actually set up the colours however you like.
(1.49) ”Bar down” or a bearish move is shown in red, so a bull candle should be green, bearish candles should be red. You can choose any kind of background that you want. Let’s choose white and go with a black foreground so that we can see the data and the levels of the currency pair. And then we go onto the current, and you have three options for a chart.
(2.21) By default you will have a bar chart, what does this mean? Let’s zoom in. These are not candles; these are bars. This is an old classic technical analysis as it appeared for the first time in the western part of the world. Technical analysis was invented when people looked for pairs to interpret future price movements over security which was typical of the stock market back then.
(2.50) They used bar charts, and you have the option to use the bar charts here. Or they used line charts and looked at the lines. This is a line that simply coincides with the closing price during the trading day, and it depends very much on the timeframe. This is the hourly chart.
(3.11) So for every hour, you have the closing price, 1 hour, 1 hour, 1 hour and so on, so this is a line chart. Unfortunately, the line chart does not give you the shadows of a candle, and it doesn’t give you the highest point in a candle or the lowest point in a candle.
(3.33) You only end up with the closing price. In the Forex market, this may be tricky, In the sense that, if you put a stop loss here, let’s just say that the market came and spiked at 112.50 coming back and closing the candle and you won’t see that move here in a line chart. But on a candlestick chart, you can see that move, and it is more realistic.
(3.58) So bar charts were the first approach to technical analysis, and a bar chart is very simple to explain. Namely from where the previous bar ends, here, the next one opens, and then you have the highest point, then the lowest point and then the close.
(4.19) And then it starts with the opening, the highest or at the lowest point, the close. The chart connects the previous closing price with the actual opening price of the candle. But the Japanese approach became famous in the Western World, and Westerners embraced the Japanese candlesticks as they are very powerful.
(4.44) We have plenty of examples of Japanese candles here on our trading academy, especially reversal patterns which form and they are quite easy to spot.
(5.01) Anyways, between the three options that we have here; a candlestick chart, a bar or a line chart on the MetaTrader, candlestick charts are the most popular or most used charts among retail traders, so we will use the candlestick charts.
(5.19) Let’s go back to properties, and then on to the colours, let’s say we go back and choose white for the background and black for the foreground. Bar up, green and bar down, red, bull candle we choose green, bear candle, choose red, so we have all the colours set up again.
(5.44) And on the common we have the chart shift. We want the chart to shift so that we have room here for analysis, and we can just have candlesticks and no OHLC as we explained in the previous analysis. No grid and if we click ok the chart will appear in front of us.
(6.04) If we take a look here, we have a small arrow here on top of the screen (points to arrow), now this small arrow, if you click on it, and drag, then a vertical line appears. Using it, we can shift the chart back to halfway across the screen. This will create all this room here for analysis. What kind of analysis?
(6.27) Drawing a trend line for example, further in time, And then maybe if we have a trend line of a triangle, then maybe the market broke the trend line, comes story tests, and it gives you future support and so on. I am just giving you ideas on how to use the space on the right-hand side.
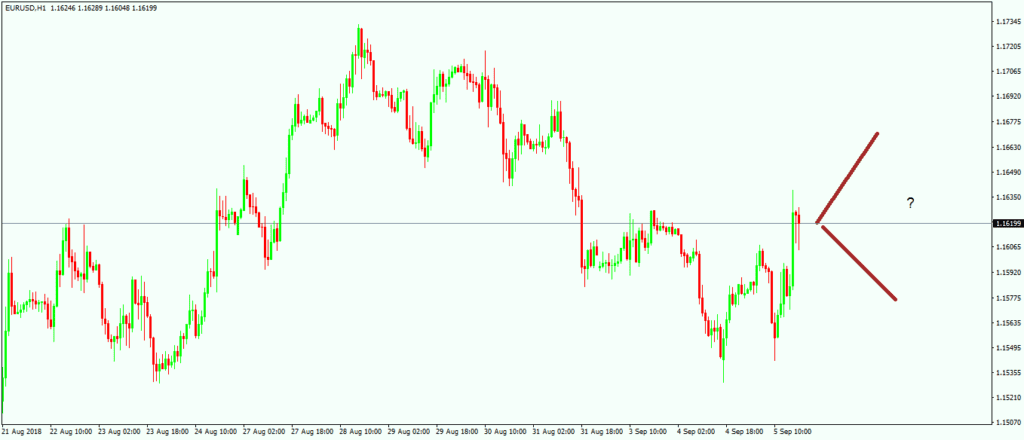
(6.50) Let us assume that we have set up such a chart for the US Dollar/ Japanese Yen, and then we want to interpret this kind of bullish flag for the pair, keep in mind that everything we do on the MetaTrader, any setup that you make on the MetaTrader won’t save automatically. It will ONLY save when you close the trading platform. So you must close the trading platform.
(7.20) Open it again, and your work is saved. Right now, let’s say something happened like the power goes off. Or the trading platform gets blocked, or there is a problem with the internet etc. then your work won’t be saved. You have got to be very careful to save it, so you should close the platform from time to time. Especially when you set the parameters for your charts.
(7.53) Here you have the hourly chart for the USD/Japanese yen, but as you see, we can easily it is to switch to the four-hour chart or switch to the daily chart, the daily prospective. And so on. But we do not want to repeat the process that we described here.
(8.13) We don’t want to repeat these steps every time. If we open a new chart, “File” “New Chart” and choose USD/Swiss Franc, we do not want to go back to properties, and so on, we can easily save the work that we have done, as a template, and then we use this template for any currency pair.
(8.36) Timeframe we want in the future. Right-click, template, save “template”. So we go with this template. Topratedforexbrokers and then we save. And we open a new chart or the one that we have open, for example, the USD/ Swiss Franc and then we right-click, template, and then we simply choose the template here which is topratedforexbrokers and then the chart appears in front of us.
(9.16) There is another trick, whenever the chart opens somewhere, and you want to jump quickly to the end of it, you simply hit the END key on your keyboard, and it will take you to the end. Or if you want to go to the left side of your screen, to back-test a strategy, you simply click on the home button
(9.41) Then it shows values, in this case from 2007 in the hourly chart and you can analyze what the US Dollar/Swiss franc did and so on. The moment that you close the trading platform on the MetaTrader. Your work is saved.
(9.59) This is how you setup a chart on the MetaTrader and the next video will continue with the types of orders that we can place on the MetaTrader.
Other educational materials
- Forex Trading Accounts and the Value of a Pip
- The Importance of Swap and Spreads
- How to Enter/Exit a Trade
- How Do I Make a Profit from Forex Trading?
- Forex Market Terminology
- Profit from Forex Trading Using Different Trading Styles
Recommended further reading
- Testing for arbitrage opportunities within the foreign exchange market. Hussain, I. (2009).
- “INNOVATE ONLINE TRADING BY ADDING SOFTWARE BRIDGE: IDEA AND IMPLEMENTATION.” (2014). Qureshi, Muhammad.
Most visited Forex reviews
Related Articles