Video Transcription: How to Set up a Chart in Metatrader
Hello there, this is Topratedforexbrokers.com here, and we continue our trading academy with a new concept regarding the charts and the MetaTrader. You know what the MetaTrader is? It’s the most popular trading platform when it comes to retail trading. And today we will discuss the particulars of a chart of a currency pair.
(0.25) First of all, you must pick a currency from this MarketWatch here. And it doesn’t matter what that currency is, as the steps that we will discuss here will be valid for both the Metatrader 4 and Metatrader 5.
(0.43) So, for example, let’s choose USD / Japanese Yen. We can either click and drag a currency pair on an actual chart that is already in front of us, like this, and then you will have the USD/Japanese Yen on the screen, or, right-click, and we go for chart window and a new chart window here will open with the desired currency.
(1.11) If we want to have more space for analysis, we can close the market watch from here. You can easily open it and close it just by selecting it, and now the chart is showing across the screen. Let’s repeat the steps that we discussed in the previous video. Right click properties and go to the ‘colours’ and go either “bar up” where a bullish move is usually associated with the colour green, but you can actually set up the colours however you like.
(1.49) ”Bar down” or a bearish move is shown in red, so a bull candle should be green, bearish candles should be red. You can choose any kind of background that you want. Let’s choose white and go with a black foreground so that we can see the data and the levels of the currency pair. And then we go onto the current, and you have three options for a chart.
(2.21) By default you will have a bar chart, what does this mean? Let’s zoom in. These are not candles; these are bars. This is an old classic technical analysis as it appeared for the first time in the western part of the world. Technical analysis was invented when people looked for pairs to interpret future price movements over security which was typical of the stock market back then.
(2.50) They used bar charts, and you have the option to use the bar charts here. Or they used line charts and looked at the lines. This is a line that simply coincides with the closing price during the trading day, and it depends very much on the timeframe. This is the hourly chart.
(3.11) So for every hour, you have the closing price, 1 hour, 1 hour, 1 hour and so on, so this is a line chart. Unfortunately, the line chart does not give you the shadows of a candle, and it doesn’t give you the highest point in a candle or the lowest point in a candle.
(3.33) You only end up with the closing price. In the Forex market, this may be tricky, In the sense that, if you put a stop loss here, let’s just say that the market came and spiked at 112.50 coming back and closing the candle and you won’t see that move here in a line chart. But on a candlestick chart, you can see that move, and it is more realistic.
(3.58) So bar charts were the first approach to technical analysis, and a bar chart is very simple to explain. Namely from where the previous bar ends, here, the next one opens, and then you have the highest point, then the lowest point and then the close.
(4.19) And then it starts with the opening, the highest or at the lowest point, the close. The chart connects the previous closing price with the actual opening price of the candle. But the Japanese approach became famous in the Western World, and Westerners embraced the Japanese candlesticks as they are very powerful.
(4.44) We have plenty of examples of Japanese candles here on our trading academy, especially reversal patterns which form and they are quite easy to spot.
(5.01) Anyways, between the three options that we have here; a candlestick chart, a bar or a line chart on the MetaTrader, candlestick charts are the most popular or most used charts among retail traders, so we will use the candlestick charts.
(5.19) Let’s go back to properties, and then on to the colours, let’s say we go back and choose white for the background and black for the foreground. Bar up, green and bar down, red, bull candle we choose green, bear candle, choose red, so we have all the colours set up again.
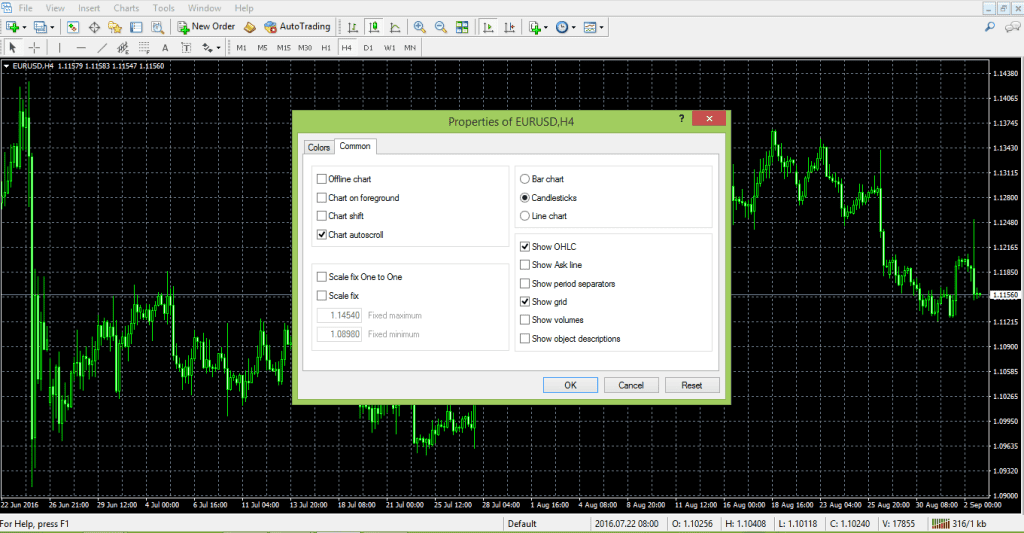
(5.44) And on the common we have the chart shift. We want the chart to shift so that we have room here for analysis, and we can just have candlesticks and no OHLC as we explained in the previous analysis. No grid and if we click ok the chart will appear in front of us.
(6.04) If we take a look here, we have a small arrow here on top of the screen (points to arrow), now this small arrow, if you click on it, and drag, then a vertical line appears. Using it, we can shift the chart back to halfway across the screen. This will create all this room here for analysis. What kind of analysis?
(6.27) Drawing a trend line for example, further in time, And then maybe if we have a trend line of a triangle, then maybe the market broke the trend line, comes story tests, and it gives you future support and so on. I am just giving you ideas on how to use the space on the right-hand side.
(6.50) Let us assume that we have set up such a chart for the US Dollar/ Japanese Yen, and then we want to interpret this kind of bullish flag for the pair, keep in mind that everything we do on the MetaTrader, any setup that you make on the MetaTrader won’t save automatically. It will ONLY save when you close the trading platform. So you must close the trading platform.
(7.20) Open it again, and your work is saved. Right now, let’s say something happened like the power goes off. Or the trading platform gets blocked, or there is a problem with the internet etc. then your work won’t be saved. You have got to be very careful to save it, so you should close the platform from time to time. Especially when you set the parameters for your charts.
(7.53) Here you have the hourly chart for the USD/Japanese yen, but as you see, we can easily it is to switch to the four-hour chart or switch to the daily chart, the daily prospective. And so on. But we do not want to repeat the process that we described here.
(8.13) We don’t want to repeat these steps every time. If we open a new chart, “File” “New Chart” and choose USD/Swiss Franc, we do not want to go back to properties, and so on, we can easily save the work that we have done, as a template, and then we use this template for any currency pair.
(8.36) Timeframe we want in the future. Right-click, template, save „template“. So we go with this template. Topratedforexbrokers and then we save. And we open a new chart or the one that we have open, for example, the USD/ Swiss Franc and then we right-click, template, and then we simply choose the template here which is topratedforexbrokers and then the chart appears in front of us.
(9.16) There is another trick, whenever the chart opens somewhere, and you want to jump quickly to the end of it, you simply hit the END key on your keyboard, and it will take you to the end. Or if you want to go to the left side of your screen, to back-test a strategy, you simply click on the home button
(9.41) Then it shows values, in this case from 2007 in the hourly chart and you can analyze what the US Dollar/Swiss franc did and so on. The moment that you close the trading platform on the MetaTrader. Your work is saved.
(9.59) This is how you setup a chart on the MetaTrader and the next video will continue with the types of orders that we can place on the MetaTrader.
Die technische Analyse befasst sich mit der Interpretation historischer Preise und Muster mit dem Ziel, zukünftige Preismuster auf der richtigen Seite eines Charts zu prognostizieren. Es gibt Handelstheorien, die eine tiefgehende Analyse von historischen Preisen erfordern, bis ein Händler für sein Trading nützliche Zeiträume findet. Ein Beispiel für eine solche Theorie ist die Elliott-Wellen-Theorie und die Fähigkeit, einen Chart in MetaTrader zu erstellen, wird sicherlich dazu beitragen, die Zeiträume zu automatisieren. Andere Händler verwenden verschiedene technische Indikatoren wie Trend-Indikatoren oder Oszillatoren beim Ein- oder Austritt eines Trades. Damit dies in MetaTrader gelingt, gibt es einige grundlegende Dinge zu wissen.
Einstellen der Plattform
Das Eröffnen eines Charts mit den Standardeinstellungen von MetaTrader wird wie unten im Bild dargestellt. Für Trading-Zwecke ist es nicht wirklich nützlich, ebenso wenig für Ihr Charting beim Handel im Forex.
Es gibt verschiedene Dinge, die mit solch einem Chart zu tun sind. Zuerst erfolgt die Auswahl der Art des Charts, welches Sie verwenden möchten: Candlesticks, Balken- oder Liniendiagramme.
Es wird dringend empfohlen, ein Candlestick-Chart zu verwenden, da beim Preishöchststand Japanese-Candlestick-Techniken angewendet werden können. Die drei Optionen bei der Wahl des Chart-Typs sind in der oberen Hälfte der MetaTrader-Plattform genau in der Mitte zu finden. Nachdem wir ein Candlestick-Chart gewählt haben, müssen wir wissen, wie diese Kerzen zu unterscheiden sind. Das bedeutet, zu erkennen, wann der Preis steigt und wann er nach unten bewegt wird. Es wird empfohlen, die folgenden Schritte durchzuführen:
- Klicken Sie mit der rechten Maustaste auf den Chart und wählen Sie „Eigenschaften“. Öffne Sie zuerst die Registerkarte „Farben“, hier können wir die gewünschten Farben für alle Elemente auswählen, die gerade auf dem Chart erscheinen. Die Standardfarbe für den Hintergrund ist Schwarz, und dabei belassen wir es für den Moment erst einmal. Es sollte aber beachtet werden, dass er in jede andere Farbe geändert werden kann. Im Vordergrund befinden sich die Preis-Level auf der rechten Seite des Bildschirms, und das Zeitelement wird auf der horizontalen unteren Seite des Charts dargestellt. Die Vordergrundfarbe muss sich von der Hintergrundfarbe unterscheiden, da sonst die Information nicht sichtbar ist. In diesem Fall bleiben wir bei Weiß.
- Das Raster wird durch die kleinen Kästchen gebildet, in die der Bildschirm aufgeteilt ist. Später haben wir die Möglichkeit, sie verschwinden zu lassen, wenn mir möchten. Dort können wir nun die Farbe ändern, falls wir diese Option nutzen wollen.
- Up-Balken, Down-Balken, Bull-Kerze und Bear-Kerze repräsentieren die Möglichkeiten, die wir zum Einfärben der Kerzen haben. Die herkömmliche Farbe für eine „bearishe“ oder abfallende Kerze ist Rot, während Grün immer eine Kerze zeigt, die sich im Anstieg befindet.
- Die restlichen Linien sind beim Erstellen eines Charts nicht so wichtig, und es ist an der Zeit, zur Registerkarte „Allgemein“ zu wechseln, ganz oben links bei „Eigenschaften“. Wie Sie hier sehen können, ist die Chart-Autoscroll-Option die Standardoption, wir möchten aber keinen Chart, der Sie immer zu den aktuellen Preisen lenkt. Die technische Analyse beinhaltet einen Blick zurück in die Zeit und dies erfolgt durch das Auswählen der Option „Chart-Shift“ und das Beenden der Chart-Autoscroll-Option.
- Wenn Sie das Raster nicht anzeigen lassen, sieht der Chart so aus.
Speichern einer Vorlage
Als nächster Schritt erfolgt die Automatisierung dieses Prozesses, um es beim Öffnen eines neuen Charts nicht jedes Mal wiederholen zu müssen. Dies geschieht, indem Sie den Chart als Vorlage speichern. Klicken Sie dazu mit der rechten Maustaste auf den Chart und wählen Sie die Registerkarte „Vorlage“. Dort gehen Sie auf „Vorlage speichern“, geben einen Namen ein, und das ist es schon.
Von jetzt an kann jedes Mal durch Laden diese Vorlage verwendet werden, wenn ein neues Chart für irgendein Währungspaar eröffnet wird, oder für dasselbe Währungspaar für einen anderen Zeitraum.

Speichern eines Profils
Nach dem Speichern einer Vorlage kann eine technische Analyse durchgeführt werden. Abhängig von der Art der verwendeten technischen Analyse können verschiedene Dinge auf ein Chart angewandt werden. Elliott-Wellen-Händler verwenden diese Theorie, um die Wellen effektiv zu messen, so dass ein Handels-Chart mit vielen Zahlen und Buchstaben darauf erscheinen wird. Diese Händler versuchen eine Interpretation dahingehend, ob der Markt eine Impuls- oder Korrekturbewegung macht. Nach Elliott bestehen Preisbewegungen aus fünf Wellen, korrigiert mit drei weiteren. Zahlen werden verwendet, um Impulswellen, oder die fünf Wellen, zu nummerieren, während Buchstaben verwendet werden, um Korrekturwellen zu bezeichnen. Andere Händler verwenden Trendindikatoren (diese Indikatoren werden auf die tatsächlichen Kerzen angewendet, die auf dem Chart zu sehen sind) oder Oszillatoren (Oszillatoren werden immer am unteren Rand des Charts und nicht auf die tatsächlichen Kerzen angewendet), um herauszufinden wann ein Markteintritt- oder -austritt erfolgen soll. Die Marktgeometrie kann ebenso verwendet werden. Dies beinhaltet viele Linien und Kanäle, die bei älteren Preisen starten und auf der richtigen Seite des Charts dargestellt sind, um Unterstützungs- und Widerstandsebenen zu erkennen. Diese haben eine bestimmte Wichtigkeit und können beim Handeln genutzt werden.
Unabhängig davon, welcher Trading-Stil oder welche Art technischer Analyse in einem Chart angewendet wird, kann dies jederzeit als Profil gespeichert werden. Das Schließen der MetaTrader-Plattform bedeutet, dass die Arbeit und das Profil automatisch gespeichert werden, durch erneutes Öffnen wird die Arbeit von dort aus wieder gestartet. Ein Profil kann einfach auf einem anderen MetaTrader-Account hochgeladen werden, was eine der großartigen Eigenschaften dieser Handelsplattform ist. Das oben Erwähnte ist nur ein kleiner Teil der Informationen darüber, wie man einen Chart in MetaTrader erstellt und wie man den Chart-Bereich zur Marktanalyse benutzt. Nur durch hartes Arbeiten und eigene Erfahrungen bekommen Sie eine Vorstellung davon, warum MetaTrader die beste Handelsplattform der Welt für Einzelhändler ist.
Die besten und vertrauenswürdigsten Forex-Broker im 2026

Welcome Bonus
100%
Min Deposit: $100
Fully automated MT4 trader, limited to 9 currency pairs.
Starting price: $199
Verified trading by Mislav Nikolic & Chris Svorcik.
Starting price: €199

FXTM’s Dow Jones news advisor comes with in-built calendar events.
Starting price: $10
Cryptocurrency Trading
40+ currency pairs
Min Deposit: $100
Other educational materials
- Forex Trading Accounts and the Value of a Pip
- The Importance of Swap and Spreads
- How to Enter/Exit a Trade
- How Do I Make a Profit from Forex Trading?
- Forex Market Terminology
- Profit from Forex Trading Using Different Trading Styles
Recommended further reading
- Testing for arbitrage opportunities within the foreign exchange market. Hussain, I. (2009).
- „INNOVATE ONLINE TRADING BY ADDING SOFTWARE BRIDGE: IDEA AND IMPLEMENTATION.“ (2014). Qureshi, Muhammad.


