

Full Definition to Pennants in Forex
Technical analysis is based on finding repetitive patterns with the idea of projecting future price action on the right side of the chart in order to speculate from that move. Being either bullish or bearish, these repetitive patterns can be reversal or continuation ones. Reversal patterns are numerous, and here on the Forex Trading Academy project, we’ve covered almost all of them: double and triple tops and bottoms, rising or falling wedges, triangles at the end of complex corrections, and the classical reversal patterns given by the Japanese candlestick techniques. As you can see, reversal patterns are well represented in the technical analysis field. It is not the same thing when it comes to continuation patterns, though, as there are not that many of them and they do not happen that often. So far we’ve treated the doji candle as a continuation pattern, as well as some triangles that are part of complex corrections within the Elliott Waves theory. Still, in the triangular formations, a pennant is the most powerful continuation pattern of them all.
| Broker | Bonus | More |
|---|
Treating a Pennant
As mentioned above, a pennant is a continuation pattern; that is, it indicates that price will continue in the same direction as the one before the pennant’s formation. However, there is another important thing to consider: A pennant only appears in bullish trends. It means that in a bearish market we cannot talk about a pennant forming, even though sometimes the market seems to form similar formations in bearish trends as well. This is a very important statement, and traders mistakenly use the rules of a pennant in bearish trends as well, which is always wrong.
Defining a Pennant
A pennant is a triangular formation that follows an aggressive upward move. This upward move is most of the time an almost vertical one, and the fact that the market is taking some time to consolidate before another leg higher means that it is trying to overcome resistance. Retracement levels within the pennant formation are quite small. When compared with the aggressive upward move prior to the pennant formation, the market rarely retraces more than 38.2%, with a move between 23.6% and 38.2% being more likely. The consolidation area that characterises a pennant, or the triangular formation, should always give the impression that the market is on the verge of breaking higher. Such areas form ahead of important resistance levels, such as the area given by a stronger moving average, or a confluence area given by a multiple dynamic and/or horizontal support.
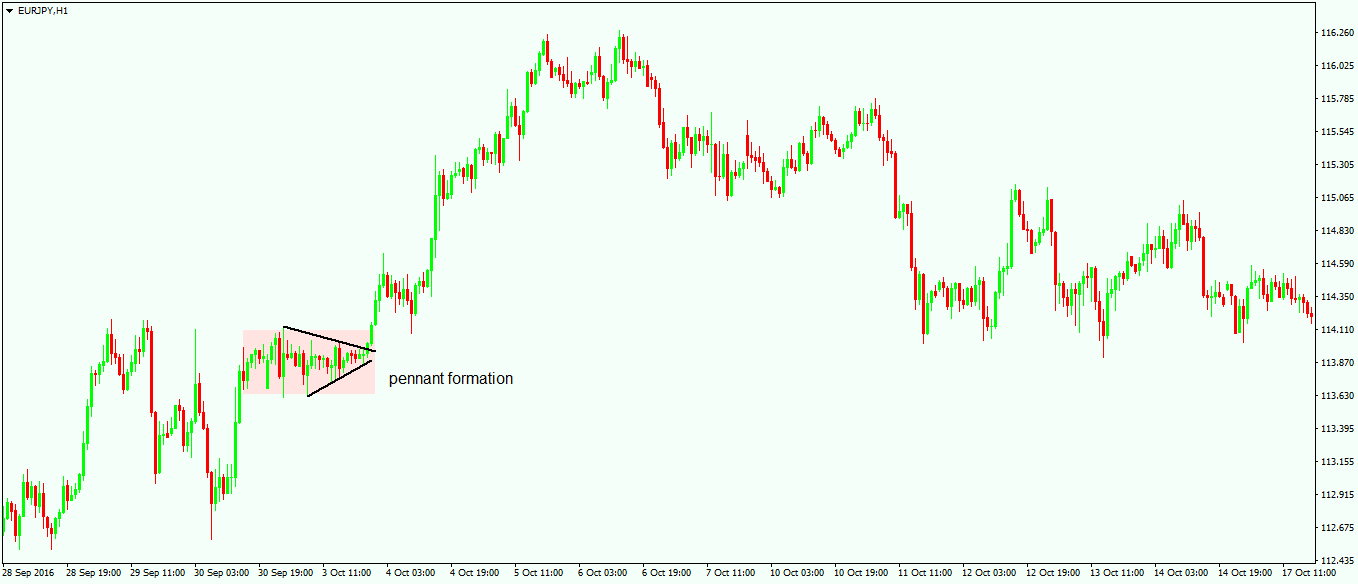
The chart above shows a pennant formation on the hourly timeframe on the EUR/JPY cross and it depicts the bullish nature of it. Price is simply not able to retrace much of the previous strong bullish move, mostly finding support on the 23.6% retracement, while the move that follows is quite aggressive. The triangular formation is supposed to act as propelling the price higher after the break. Sometimes the upper side of the triangle, or the b–d trendline, is retested, but this is not mandatory. As a matter of fact, if the b–d trendline is retested, it means that the pennant is not such a strong pattern after all.
Trading a Pennant
There are different approaches to trading a pennant, and they differ based on the trading tool/theory used. If traders use the Elliott Waves theory, it should be noted that pennants are most likely to be found during complex corrections, as part of them. It would therefore be inappropriate to label a pennant (or the triangle) as a b-wave in a zigzag, or the fourth wave in an impulsive move, as this has little chance of coming true. What is most likely is the fact that the pennant will be part of a complex correction, most of the time an x-wave in a running corrective move. Nevertheless, trading a pattern should follow these steps:
- Look for a strong, almost vertical move, followed by a small consolidation. Ideally, the timeframe should be the 4-hours chart or higher, as traders need a bit of a time to spot the pennant. Otherwise, if it forms, say, on the 5-minute chart, by the time it is spotted it is most likely already breaking higher .
- Take a Fibonacci retracement tool and use it to measure the move prior to the pennant formation. This is going to be helpful in finding the 38.2% and 23.6% retracement levels.
- Place a pending buy limit order, or simply go long at the market by the time the price retraces into the 23.6%, and add on a move to 38.2%. If the timeframe is long enough, such as the daily or even weekly one, then simply draw the Fibonacci levels and then go onto the shorter timeframes to trade the future triangle.
- Check the Forex Trading Academy articles dedicated to the Elliott Waves theory that show how to trade a triangle. All that information is very useful for identifying the moment a triangle breaks higher, as well as what the whole pattern should be part of.
- Look for the moment when the triangle breaks higher. When this happens, simply take the whole length of the move prior to the pennant formation and project it from the moment the b–d trend line corresponding to the triangle breaks higher. This should act as a measured move (similar to the measured move of a head and shoulders pattern) and represent the take profit for the long trade/trades. As for the stop loss, use the lowest point in the triangular formation as being the invalidation point.
As you can see, trading a pennant is straightforward as the pattern is simple and easy to understand. However, the steps mentioned above should be followed to keep a trader on the right side of the market, as otherwise it is very easy to mess up around the pennant. What traders should look to avoid is the pennant transforming into a bullish flag. Not that the outcome is going to be different when it comes to the overall direction the market is going to break in, but a bullish flat simply takes more time before breaking higher. If it is forms on the longer timeframes, you can imagine how frustrating this can be.
With that said, it is time to move on to the last article in our section dedicated to other things to consider in technical analysis. This coming article is perhaps the most important one of them all, as it deals with the time element, which is part of the holy grail when trading the Forex market.
Other educational materials
- How to Use Parabolic SAR to Buy Dips or Sell Spikes
- Different Trading Styles
- Trading with the Cloud – Use Ichimoku Cloud to Spot Reversals
- Forex Market Terminology
- Japanese Exchange Group (JPX)
- FTSE All-Share Index
Recommended further readings
- “Chart Patterns Trader.” Matras, Kevin.
- Encyclopedia of chart patterns. Bulkowski, Thomas N. Vol. 225. John Wiley & Sons, 2011.
Related Articles