Complete Guide to Elliot Waves Theory
Elliott Waves theory is one of the most famous trading theories of them all, and is well known by traders around the world. It was developed in the early 1900s by Ralph Elliott, whose findings were based on studies of the stock market.
Before going into more detail regarding this wonderful trading theory, it is worth mentioning that Elliott’s findings were based on the stock market. All the rules and principles Elliott documented were based on the stock market in the 1920s and, to quite some extent, his trading predictions turned out to be extremely accurate.
Elliott’s general belief was that the market moves in repetitive cycles and the reason for this is human nature itself. Market psychology therefore plays an important role in any upward or downward move, and this is the very starting point the whole theory is based on: interpreting the upward and downward swings the market makes.
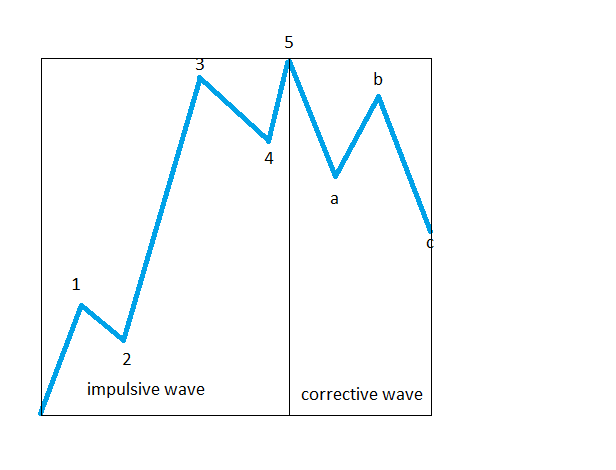
The most important of Elliott’s findings was the fact that, regardless of whether the move is to the upside or to the downside (bullish or bearish), it unfolds in five parts. And just like that, the waves concept appeared. According to Elliott, the market advances or declines in five-wave structures, and such a decline is always being followed by a three-wave correction in the opposite direction. This is the basis of Elliott Waves theory: five-wave structures followed by three-wave corrections.
| Broker | Bonus | More |
|---|
Elliott Cycles and Logical Process
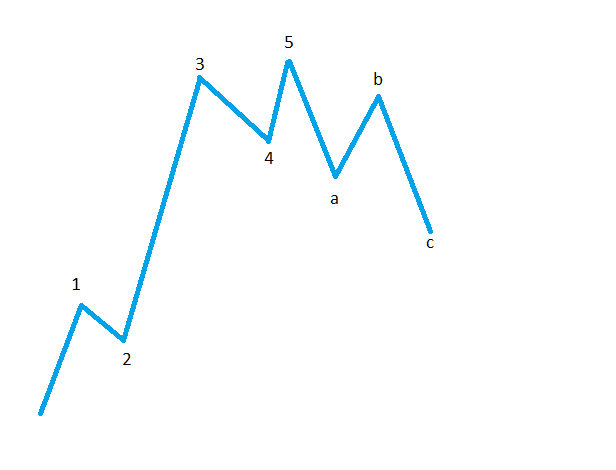
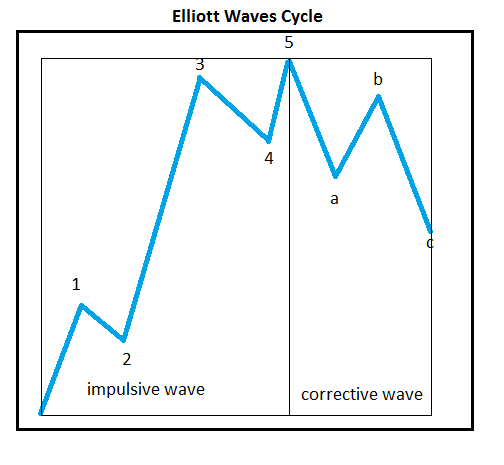
Elliott described any five-wave structure as an impulsive wave (some people refer to it as a motive wave as well, but the idea is the same), and labelled it with numbers. Therefore, an impulsive wave will be labeled with 1-2-3-4-5.
The three-wave correction that follows is called a corrective structure. Corrections are always labelled with letters: a-b-c.
Putting the two paragraphs together, the whole theory can be summarised as a 1-2-3-4-5 advance/decline followed by an a-b-c move in the opposite direction. This is the gist of what the Elliott Waves theory is, and the overall concept seems amazingly simple.
However, this apparent simplicity is just an illusion. It is correct that this is the basis for the overall trading theory, but Elliot identified a variety of cycles of different degree that, combined together, form the patterns needed to forecast the future direction of the market.
Defining a Cycle
Based on what has been mentioned so far, an Elliott cycle is formed from a 1-2-3-4-5 advance or decline, followed by an a-b-c correction. One cycle is therefore formed out of an impulsive wave followed by a correction.
Such a cycle is the cornerstone of the whole Elliott Waves theory, and a proper analysis involves multiple cycles of different degrees. This is where the theory gets complicated as, at any one moment in time, cycles of different degrees may end up in the same place, or may start from the same place.
Any Elliott Waves analysis should start from the longest timeframe possible and then slowly but surely continue the analysis all the way down to the hourly chart. This means that different cycles of different degrees are to be labelled, starting with the longer cycle on the monthly chart (or even yearly charts if there is enough data to base the analysis on), and then coming down to the shorter timeframes where cycles of lower degrees can be identified.
An analysis like this is called a top-down analysis, coming from the fact that the analysis is made from the longer to the shorter time frame. In this way, a trader knows exactly where the count left, and how to project future price levels.
Logical Process of Elliott Waves
So far the Elliott Waves principle is a simple one to understand, and the overall idea makes sense considering that markets act and react to a multitude of outside stimuli. After all, the whole theory is based on an action and reaction to different market conditions. However, above all, counting waves with Elliott Waves theory is the subject of a so-called logical process that should govern a traders’ analysis. This logical process should start from the very first division Elliott made: between impulsive and corrective waves.
In other words, before even labelling a specific wave (or a move the market makes), a trader should answer the following question: Did the market form an impulsive or a corrective wave? The answer to this question is a crucial one, as from this moment on the whole analysis will be split into two different paths.
If it is an impulsive move, then such a move must respect the rules of an impulsive wave, starting with what kind of an impulsive wave it is, its location, its extensions, the distance to be travelled, and even the time it takes for it to unfold. All these are taken into consideration, and are part of this logical process.
On the other hand, if the move is considered to be a corrective one, then the next thing is to decide what kind of a correction it is: a simple or a complex one. If it is a simple one, the trader should focus on having it confirmed, as this is mandatory. Complex corrections will have even more ramifications in the overall analytical process.
Putting Everything Together
To sum up this introductory article to Elliott Waves theory, impulsive and corrective waves of different degrees come together to complete a technical analysis picture that allows a trader to forecast future price changes.
These price changes are derived from an analytical thinking process that takes into account various factors, the most important one being market psychology. Elliott Waves theory is all about psychology, and it is the only trading theory that allows a trader to come close to what is considered to be the holy grail in trading: putting a time to a price target.
Due to its complexity, the theory fits perfectly into the Forex market, which is the most complex market in the world. The fact that the patterns described by Elliott are repetitive in nature and reflect crowd psychology and human nature makes it the perfect theory for analysing foreign exchange moves. Because of this, the Elliott Waves theory is well represented in our Forex Trading Academy. For anyone involved in trading financial markets, and Forex, in particular, Elliott Waves theory is a must.
Other educational materials
- Defining Impulsive Waves
- Defining Corrective Waves
- Use the Fibonacci Extension Tool in Elliott Waves Theory
- Different Fibonacci Levels Important When Trading with Elliott
- Trading Different Types of Extended Waves
- Bill Williams – How to Use Williams Indicators When Trading Forex
Recommended further readings
- Elliott Wave Principle: Key to Market Behavior, Alfred John Frost, Robert Rougelot Prechter, Elliott Wave International, 2005
- Introduction to the Wave Principle, Elliott Wave International (EWI)


