Bill Williams is a famous technical analyst who in his time developed many indicators with uses in the technical analysis field. Many indicators are credited to be his creation, and traders use them in conjunction with other trend indicators or oscillators, with the idea of filtering out fake signals and trading only the right ones.
The MetaTrader 4 trading platform has a whole tab dedicated to Bill Williams indicators, and there are no less than six indicators listed under the Insert/Indicators/Bill Williams tabs. These are the Accelerator Oscillator, the Alligator, the Awesome Oscillator, the Fractals Indicator, the Gator Oscillator, and the Market Facilitation Index.
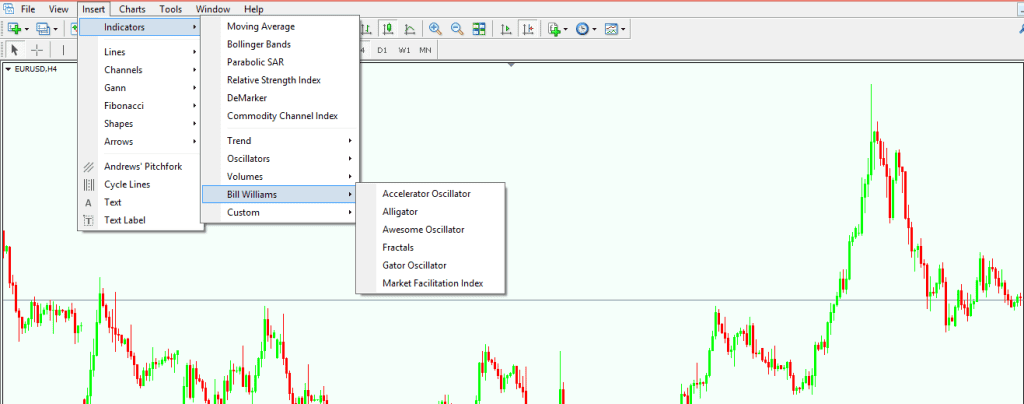
While these are too many indicators to be covered here, we will talk about the most important ones here, the general idea behind trading the Forex market with them, and what other indicators they most resemble, if any.
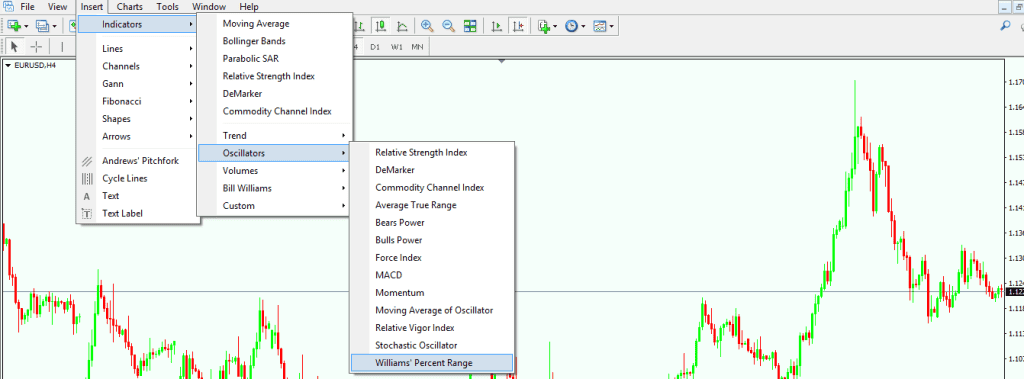
It may come as a surprise to find that there is still one more Williams indicator, but this one is listed under the Oscillators tab. It is called the Williams’ Percentage Range, and it is the most famous one of all of the technical indicators Bill Williams introduced to the technical analysis field.
How to Interpret Bill Williams Indicators
There is no straight answer to the question above, as some indicators are oscillators, other follow a trend, and some deal with both volumes and other technical aspects of a chart. This is how complex these indicators are, and why the MetaTrader4 and many other trading platforms offer them separately from other indicators.
Williams’ Percentage Range
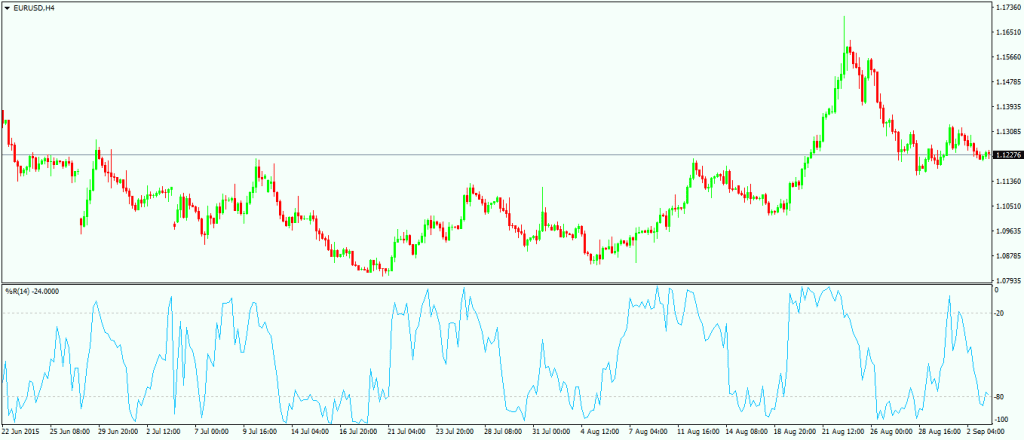
By far the most important Williams indicator, the Percentage Range, is an oscillator that travels between 0 and –100 (so it is always in negative territory). The idea behind trading with this oscillator is the classic one: Look for overbought and oversold areas (above –20 is considered an overbought area, and below –80 an oversold area) in order to sell or buy a currency pair.
It works very well together with another oscillator, such as the Relative Strength Index (RSI) and a trend indicator. The reason for this is because the Williams’ Percentage Range will filter the RSI signals, and the trend indicator will show the general direction. In this way, an integrated system is actually built, so increasing the chances of surviving the Forex market and making a profit from it.
The Alligator Indicator
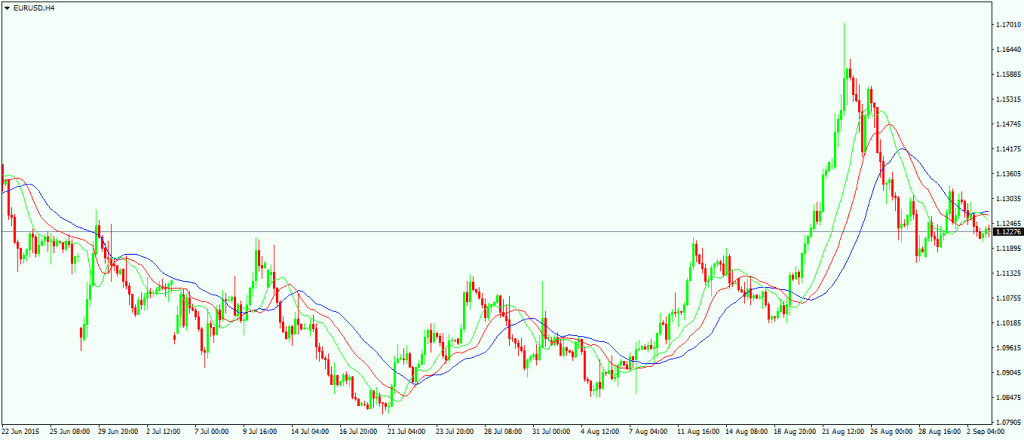
The Alligator is represented by three lines that are applied to the actual chart. You should know by now that any indicator that is applied directly on the actual chart is a trend indicator, and this one is no different.
The chart above shows the Alligator indicator the way Bill Williams developed it, and the idea behind trading with it is to interpret it the way moving averages are interpreted. Therefore, before anything else, I invite you to go and take a look at the “Moving Averages” article here on the Forex Trading Academy, and see how to trade such a set-up.
It goes without saying that perfect order between the three averages that make the Alligator indicator shows a strong trend, and every time the price is dipping or spiking into those averages should be an opportunity to add to the overall bigger trend.
The Accelerator Oscillator
This indicator resembles the Moving Average Convergence/Divergence (MACD) oscillator, in the sense that there is a histogram that can be seen by the moment the oscillator is plotted on any given timeframe. The histogram is offered in two colours, green and red, and the colours show the actual interpretation of it, red being bearish and green being bullish.
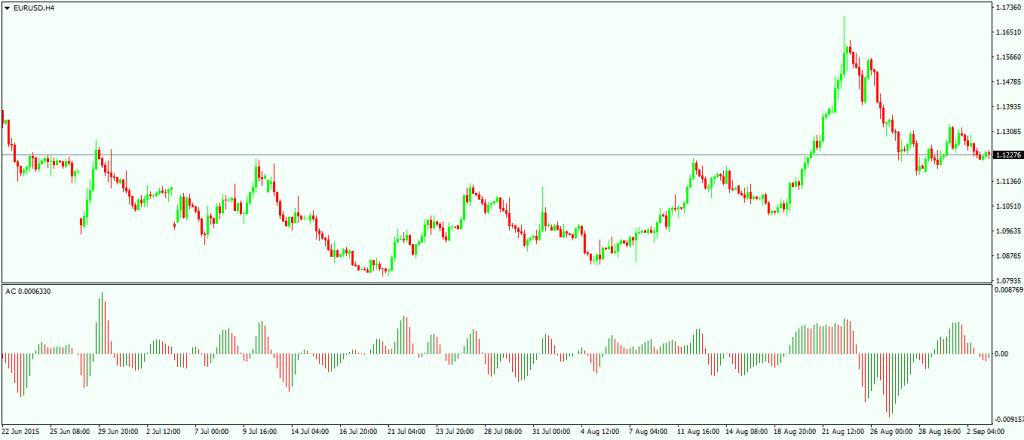
Classical bullish and bearish divergences can be used with the Accelerator oscillator, as well as continuation patterns by the time the zero level is broken. For more details about these two strategies, please check our articles on oscillators presented in this project.
The Awesome Oscillator
This oscillator, if selected, will appear below the actual chart, and it will resemble the Relative Strength Index (RSI) and the DeMarker. In fact, it can be traded in the same way, using divergences to find out levels to buy or sell at, or to actually look for continuation patterns when the price travels between overbought and oversold areas.
Speaking of overbought and oversold areas, these are not predetermined, but one needs to identify them by doing a bit of historical research to see where the price is really overbought or oversold. The next thing is to project the levels on the right side of the chart and sell by the time the overbought area is broken, or buy when the oversold area is reached.
The Gator Oscillator
This one resembles the Accelerator oscillator both in the way it looks (like a histogram in red and green colours) as well as in the way it should be interpreted. Divergences are difficult to find here due to the shape of the diagram, but selling on red and buying on green should be the right way to use it.
The Fractals Indicator
Fractals are small arrows that appear above/below an actual candle, and these arrows are indicative of the future direction the market is heading in. There are many problems with this Fractals indicator, one of them being that on the MetaTrader 4 platform, it is extremely difficult to follow as it is applied either below or above a candle, and they form pretty often, hence the reliability is questioned.
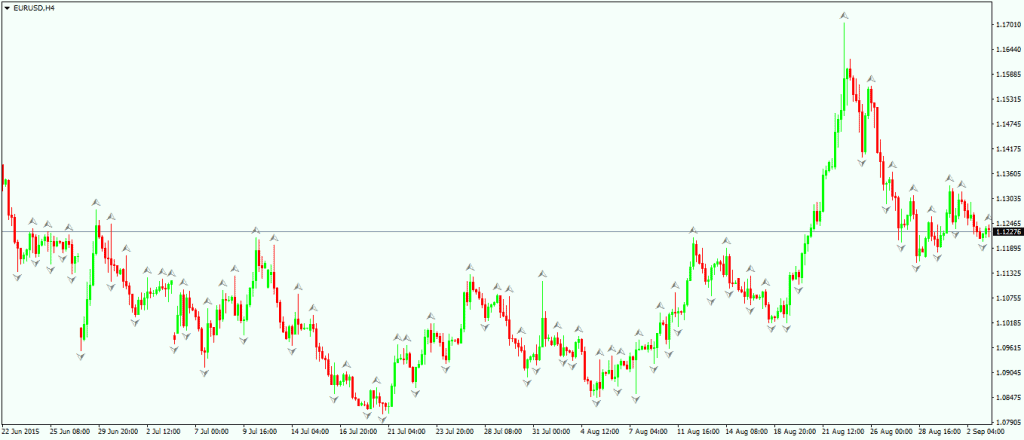
Another problem comes from the fact that these fractals repaint. Before moving forward, let me explain what repainting is. If an indicator plots a value and that value changes based on future candles or price action, it is said that the indicator is repainting. Long story short, these are not trustworthy indicators. While they may give you an idea of the overall turning point, it may be that the turning point is actually only a temporary thing. As a small conclusion, be aware of using indicators that repaint – and the Fractals indicator is surely one that offers signals that change with time.
The Market Facilitation Index Indicator
This is an indicator that falls into the volumes category, and it is one that repaints! Having said that, all that was mentioned on the Fractals indicator should be used here as well, and my advice is to closely watch for the indicator not to repaint before taking any new trading decision.
To sum up, Bill Williams technical indicators are a plus to the technical world and, used in conjunction with other trading strategies, they prove to be quite useful. With this, our section of the Forex Trading Academy dedicated to technical indicators concludes, and it is time to move on to advanced trading strategies.
Other educational materials
- How to Use Parabolic SAR to Buy Dips or Sell Spikes
- Moving Averages – Find Support and Resistance Areas
- Bollinger Bands – Profit from One of the Best Trend Indicators
- Fundamental Analysis – What It Is and How to Use It
- How Do I Make a Profit from Forex Trading?
- Forex Market Terminology
Recommended further readings
- Technical analysis of FOREX by RSI Indicator SEYED HADI MIR YAZDI, ZIBA HABIBI LASHKARY, IZLIN BINTI ISMAIL, academia.edu
- The Sensible Guide to Forex: Safer, Smarter Ways to Survive and Prosper from the Start C Wachtel – 2012


