Real brasiliano
Video Transcription: Steps to Make a Profit from Bullish and Bearish Engulfing Patterns
Hello guys, top rated forex brokers here, and we move forward with an interesting strategy to trade. Bullish and bearish engulfing. As you can see on the screen we deal with candlestick techniques and candles, therefore, one of the most powerful candlestick techniques is the engulfing pattern.
(0.21) Before anything you have to imagine this one relates to the stock market. It was invented on the stock market. On the FX market, it worked for years, it still works, but you have to be very careful with the time frame.
(0.39) Because now, the Spread, or the difference between the bid and the ask price, let me show this to you on the MetaTrader. The difference between the bid and ask price is so small that the conditions for an engulfing pattern are not there anymore. Look at the US Dollar and Swiss franc, 97520 to 97527 which is 0.7 Pips. Look at the euro-US dollar. It is 0.3 Pips.
(1.06) It is difficult to create an engulfing pattern on a bigger time frame, because if you look at the weekly chart; so let’s go to the weekly; this is the US dollar and Canadian dollar. Let’s go to the end of it and zoom in.
(1.25) With a bullish engulfing pattern or a Bearish one, you need to have a difference between the opening candle and the closing one in such a way that it will engulf the previous one.
The pattern looks like this. With a Bullish engulfing, (starts to draw) you have the body of a candle, let’s say that this is a candle, and let’s make it red so that we know it is a bearish candle.
(1.56) And then of course a red candle, with a shadow somewhere around here. Let’s make the body of it bigger like this, so this would be a red candle. then the next candle that comes, which is this green one, should totally engulf the red one like this.(green candle on screen)
(2.23) It doesn’t matter the length of the shadow, what’s important is the two bodies here (circles them). This one totally eats into the previous one. For a bullish engulfing pattern like this one, you need a Bearish trend. And then the market, of course, reverses into a Bullish tsunami. The same is valid the other way round.
(2.51) At the top, you have what? At the top, you have a strong Bullish candle followed by an even stronger bearish candle, but a candle that completely engulfs and eats into the previous one. What do we need for a candle to engulf the previous one? A gap.
(3.14) Because if this is the closing of the previous candle. And the opening price of the other one should be a bit higher to totally engulf this one, because if the opening price is here (top right of green candle), then it will not engulf this one.
(3.32) An engulfing pattern is typically a subject for the stock market. Because, when the stock market opens every day there is a gap and therefore the pattern works nicely.
(3.44) But it works on the FX market as well, let me show it to you right here on this US dollar Canadian chart. At the top the 1.46 which is on the weekly chart. The market closed or dies.
(4.00) At the opening, and this is the opening price of the new candle, and you look here at the OHLC, and closing price on the OHLC is 1.4533 and then on the new candle the opening price is 4601 which is 48 pips difference.
(4.30) So the market gets high at the opening of the new week, and closes lower on the trip; totally engulfs the previous candle. Now that is as bearish as bearish can be.
(4.42) This is called a Bearish engulfing pattern, and it shows the start of a new trend. There are two approaches to trade the Bearish engulfing or the Bullish one. To simply measure the length of the stronger candle, then to wait for a pullback.
(5.08) Ideally, you will see a pullback come into its territory about 50% 61.8% but that is not mandatory, and you might end up missing the whole point. Aggressive traders that don’t want to lose such an opportunity will go short at the closing of the second candle.
(5.31) And we will use any opportunity here to ebb on the same position. To know or to have an idea what this means for the overall reversal pattern, then the bigger the timeframe here, the more powerful the reversal will be.
(5.50) In this case, It’s a weekly chart, so if you zoom out and look at the market. So after the Bearish pattern here, imagine you go short here.
(5.59) Stop loss at the highs, even if it is on the weekly chart, the stop loss on the highs would invalidate the pattern, and you still have a risk-reward ratio of 1 to 2 or 1 to 3 for a US dollar pair, and that is quite something.
(6.20) From two simple candles, this is how Bullish and Bearish engulfing work. On the lower time frame it is very difficult, because rarely the market gaps on the hourly chart, for example, when the new candle opens, you have got to be careful with these patterns. Use them from the daily chart and the bar. These are beautiful patterns, so let’s move on to the next video.
Mentre i precedenti due articoli dedicati ai candlestick giapponesi analizzavano i pattern a una candela, questo articolo riguarda un pattern star a tre candele. Le stelle o star sono pattern di inversione che si formano esattamente alla fine di un trend. Una stella è formata da tre candele, di cui la prima appartiene a un trend precedente, quella centrale è una candela doji mentre la successiva segna già l’inizio del nuovo trend. Ci sono due tipi di stelle, a seconda di dove si forma il pattern, e la loro interpretazione è simile. Questi modelli sono così efficaci che, dopo di essi, è quasi sempre possibile identificare trend molto forti.
Tipi di stelle e pattern di inversione
Poiché le stelle si formano alla fine di un trend, esse sono pattern di inversione che possono dunque essere rialzisti o ribassisti. Un pattern di inversione rialzista è chiamato morning star (stella del mattino) mentre un pattern ribassista è chiamato evening star (stella della sera).
Broker
Caratteristiche generali della stella del mattino
Una stella del mattino è un pattern di inversione rialzista. Il suo nome deriva dal fatto che esso indica l’arrivo di prezzi più elevati, esattamente come il pianeta Mercurio annuncia il sorgere del Sole. Ci sono tre candele all’interno di una stella del mattino:
- una candela rossa grande;
- una piccola candela nel mezzo che può essere un doji o un hammer;
- una candela grande in direzione opposta che dovrebbe avere corpo verde.
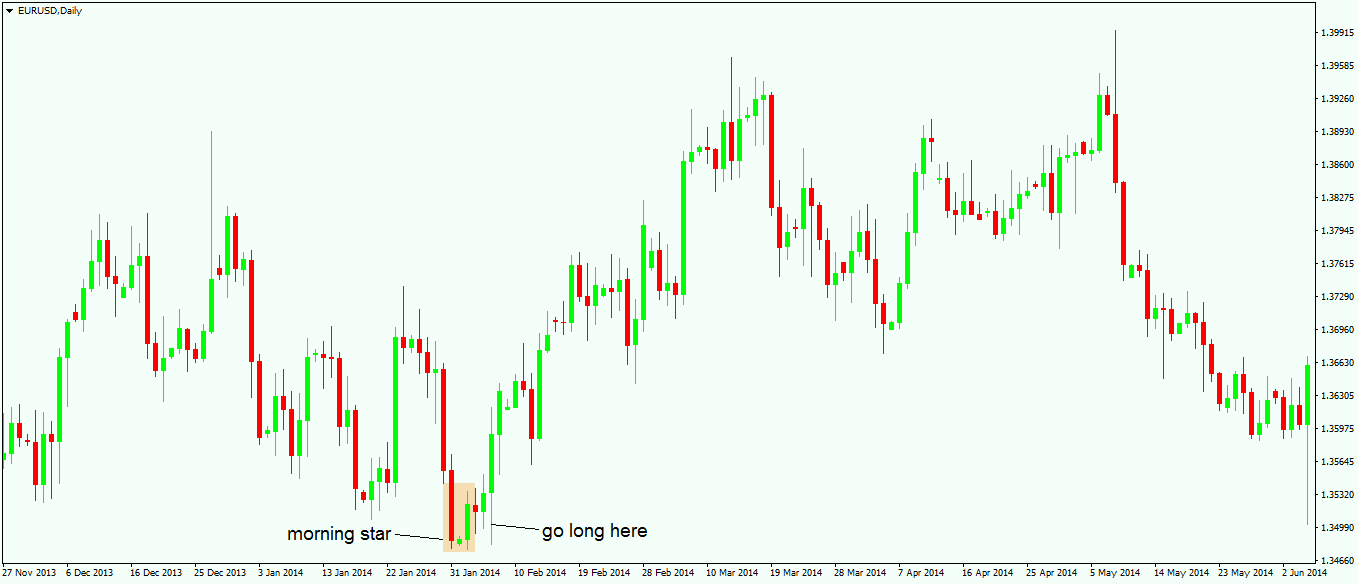
Come si può vedere nella descrizione precedente, la candela nel mezzo è un pattern di inversione a sé, come descritto nei precedenti articoli dedicati ai Candlestick giapponesi. Fare trading su questi pattern è semplice, proprio come nel caso dei pattern hammer e hanging man. L’idea qui è la stessa: per comprare dopo una stella del mattino è consigliabile attendere che inizi il ritracciamento che il mercato dovrebbe fare nel territorio della terza candela che forma il pattern In questo modo, i trader avranno un miglior rapporto rischio/ricompensa man mano che si procede. Parlando del rapporto rischio/ricompensa, questo dovrebbe essere di minimo 1:3 e lo stop loss per un trade long andrebbe impostato nel punto più basso della stella del mattino. Di solito, questo punto è dato dalla candela che si forma nel mezzo del pattern. Essendo un pattern di inversione, ci sarà una prevedibile alternanza di rialzi e ribassi, in questo caso con l’orso a dominare il mercato. È normale, quindi, attendere un pullback prima di andare long nella direzione del nuovo trend che sta per formarsi.
Il grafico qui sopra mostra una stella del mattino che si forma sul grafico giornaliero della coppia EUR/USD, e rispetta tutte le regole del pattern descritto sopra. I bassi del pattern non sono dati dalla candela centrale, ma questo non è un elemento necessario. Per entrare long in una trade è meglio attendere un ritracciamento, con un miglior rapporto rischio/rendimento.
Fare trading su una stella della sera
Come nel caso della stella del mattino, la stella della sera prende il nome da un altro pianeta, questa volta Venere, che appare nel cielo appena prima del tramonto. Come suggerisce il nome, una stella della sera è un pattern ribassista che annuncia una discesa dei prezzi. Entrambe le stelle dovrebbero presentare un divario tra i corpi della prima e della seconda candela, ma questo non è obbligatorio a causa del carattere continuo del mercato Forex. Come nel caso di un doji, dove è difficile avere gli stessi prezzi di apertura e chiusura, lo stesso accade qui con il divario tra le prime due candele. Una stella della sera, come la sua controparte, è formata da tre candele:
- la prima candela è verde e rialzista;
- la seconda è una candela doji o un hanging man, o una via di mezzo fra le due;
- il terzo è una candela rossa ribassista, con un corpo grande.
Come norma generale, valida nel caso di entrambi i pattern a stella, più la terza candela del pattern è lunga rispetto alla prima, maggiori sono le possibilità che si formi un nuovo trend. La terza candela deve avere una lunghezza pari almeno al 50% della prima.
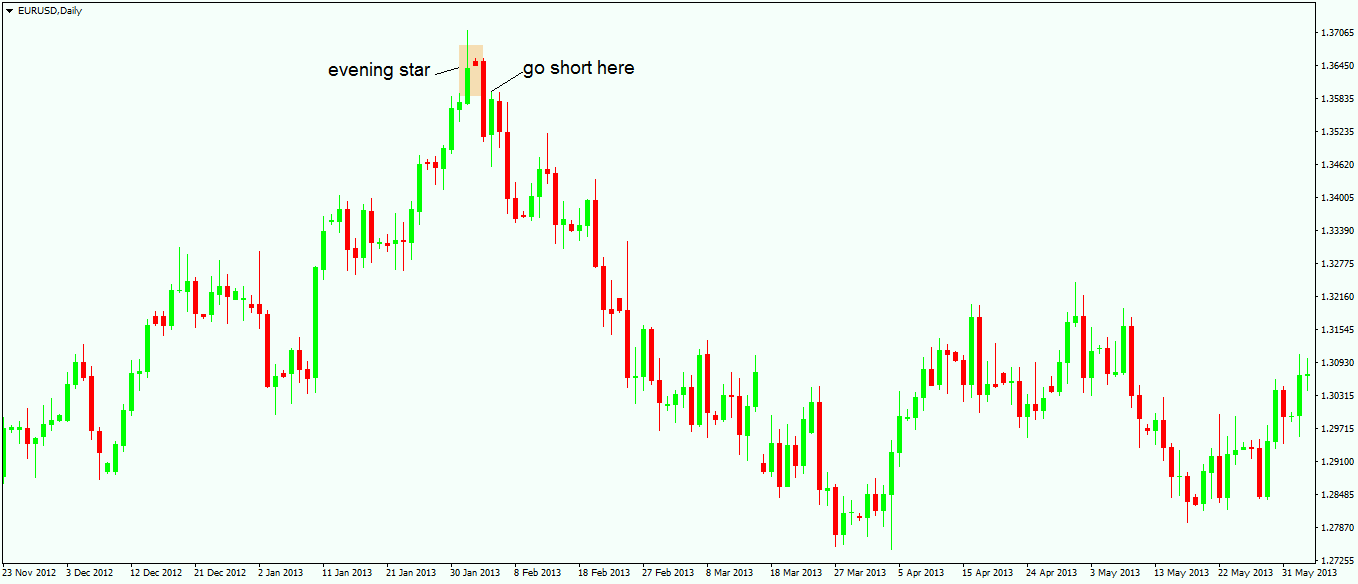
Il grafico sopra riportato è una stella della sera in cui il punto più alto è dato dalla prima candela, mentre la terza candela è lunga quasi il doppio rispetto alla prima. Ciò è un segnale che sta arrivando un trend ribassista molto forte. Per fare trading su una stella della sera di questo tipo conviene aspettare un piccolo ritracciamento nel territorio della terza candela.
Questo ritracciamento dovrebbe essere pari ad almeno il 38,2% della terza candela. Va qui ricordato che l’arrivo del ritracciamento non è obbligatorio. Alcune stelle non sono seguite da alcune ritracciamento, ma il rischio di andare a long o short subito dopo la terza candela è troppo grande per essere ignorato.
Un’altra cosa che differenzia i vari tipi di stelle è la candela centrale. Se questa è un doji, o un tipo di candela che assomiglia ad un doji, allora il modello è più potente. Tutto sommato, le stelle del mattino e della sera sono modelli di inversione importanti ed efficaci, soprattutto se proiettati su tempi più grandi (grafici settimanali o mensili). Anche qui andrebbero applicate e stesse regole di trading, solo che questa volta il rapporto rischio/rendimento risulterebbe in buoni profitti grazie al maggior tempo durante il quale si svolge il pattern. L’ultimo articolo dedicato ai candlestick giapponesi nella nostra Accademia di trading Forex si occuperà di spiegare un concetto che crea confusione tra molti trader: la differenza tra i pattern engulfing e piercing. Sono pattern abbastanza simili ma con alcune differenze importanti.
Migliori e più affidabili broker forex nel 2024
Other educational materials
- How to Use Parabolic SAR to Buy Dips or Sell Spikes
- Bollinger Bands – Profit from One of the Best Trend Indicators
- Price and Time – The Holy Grail in Trading
- Two Ways to Use Gaps When Trading Forex Markets
- Trade Forex with Fibonacci Retracement Tool
- Trade with Risk-Reward Ratios
Recommended further readings
- “What You Don’t Know About Candlesticks.” Bulkowski, Thomas N. Technical Analysis of (2011).
- BINDABLE CANDLESTICK CHART COMPONENT. Utomo, V. G. (2012). Jurnal Teknologi Informasi dan Komunikasi, 2(1), 35-40.


