The Bollinger Bands indicator gets its name from the now-famous market technician John Bollinger, and it is a trend indicator. This means it is applied to a chart, and traders use it to ride a trend as well as to spot reversal patterns. As a matter of fact, this indicator is formed out of three different lines that resemble a channel, and are called the Upper Bollinger Band (UBB), the Middle Bollinger Band (MBB) and the Lower Bollinger Band (LBB). All lines are equally important when taking a trading decision based on this indicator, but the MBB has a special significance. Depending on the broker and trading platform one uses, the MBB can be either a simple moving average (SMA) or an exponential moving average (EMA). If you refer to the moving averages article here on the Forex Trading Academy, you’ll see that in the moving averages strategy, to find out support and resistance levels it is recommended to use simple moving averages. However, when using the Bollinger Band indicator, it is recommended to use an exponential moving average for the MBB. The reason for this is that EMAs adapt in time to new price levels, and thus the MBB becomes a proactive line rather than a reactive one. The image below shows you how to plot the Bollinger Band indicator on a chart on the MetaTrader 4 trading platform. As usual with any trend indicator, by clicking Insert/Indicators/Trend, and then choosing the Bollinger Band, a pop-up window will appear on the screen.

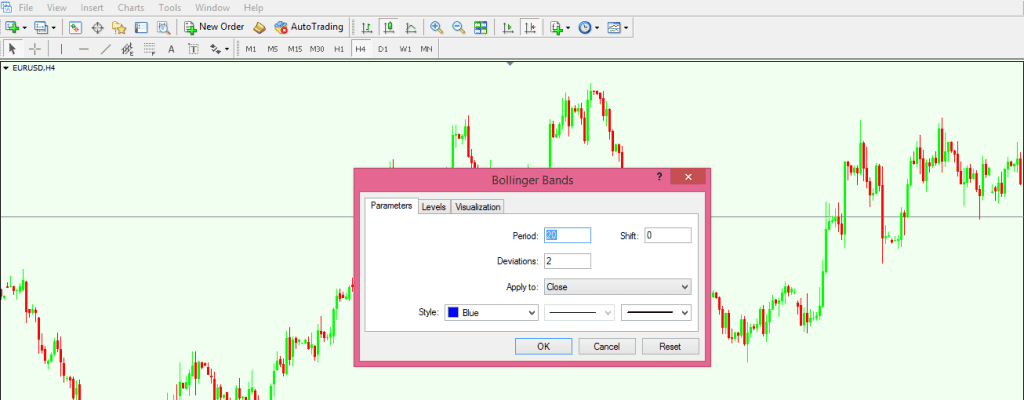
The pop-up window, as can be seen below, allows one to edit the indicator, choosing the variable for the MBB as well as the colour and size of the three lines to be plotted. It is recommended that the MBB has the 20 periods selected, and the average applied at the closing prices of each and every candle.
How to Trade with the Bollinger Bands Indicator
When compared with the Parabolic SAR indicator we presented here at Forex Trading Academy, the Bollinger Bands indicator actually allows a trader to spot a new trend and to ride it. Moreover, exiting a trend can be done swiftly, as can identifying reversal patterns. How can this be done with only three lines? It’s very simple:
The Magic of the Middle Bollinger Band (MBB)
The MBB is the most important line of the three lines that make up the Bollinger Band indicator, and in a way it resembles the effect the Median Line in Andrew’s Pitchfork has (more about that to come later in our project here). While on the Pitchfork all three lines are straight ones, on the Bollinger Band, due to the fact that they more or less represent moving averages of some sort, the lines are not straight.
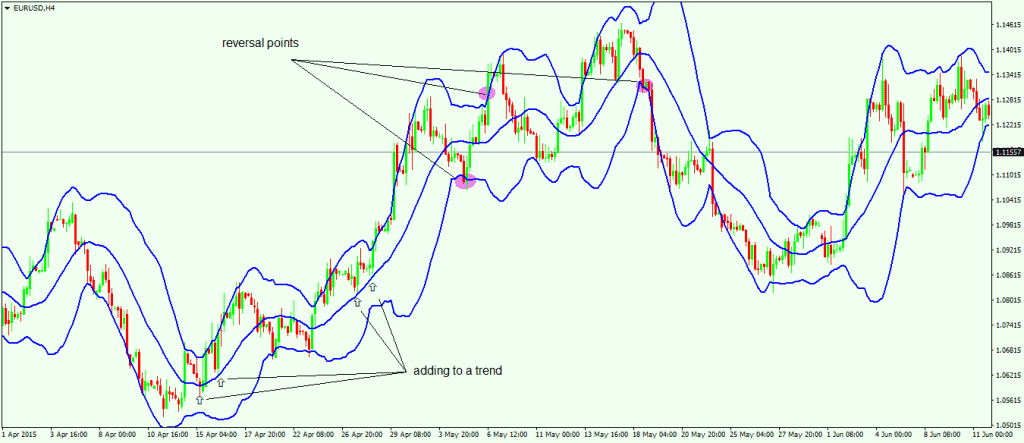
The way to use the MBB is to wait for the price to travel on the upper side of the Bollinger Bands (between MBB and UBB), as this defines a bullish trend. Using the same logic, a bearish trend forms when the price is remaining in the lower part of the Bollinger Bands indicator (between MBB and LBB). According to Elliott Waves theory, for every market action one should expect a reaction; or for every move the market makes, a correction should come. The idea is to spot that correction with the MBB so that when the price is coming into the MBB line, you can buy on a bullish trend and sell on a bearish one. The chart above shows clear entry levels for the long side, as the price is moving with a bullish trend. The longer the time frame, the more powerful the entries are. Due to the fact that the MBB is an exponential moving average, it is constantly adapting to current prices, and therefore a trader knows its level in advance with each new candle that forms. This allows traders to use pending orders when wanting to enter a new trade – but one thing should be considered before placing a pending order: Skip it if a reversal pattern has formed previously. However, the same chart shows three different reversal points. What are they, and how should they be used?
Spotting Reversal Patterns with the Bollinger Bands Indicator
To spot a reversal pattern in a current trend, or even the beginning of a new trend, UBB and LBB are used. Traders are looking for a candle to close below the LBB (if a new bearish trend is about to form), or above the UBB (if a new bullish trend is about to form). The chart above shows three reversal points. The first one turns out to be a fake move, as the price closes below the LBB and then retraces into the MBB. Using the logic just mentioned in the previous paragraphs, this calls for a short trade to be taken by the time the MBB is touched. This short should be closed in a loss by the time the price closes above the UBB, as another reversal point, this time in the direction of the previous trend, forms. However, at this point, it is not recommended to trade on the long side anymore, as the fact that price was able to form a reversal bearish pattern earlier shows that the upside trend is losing its strength. Needless to say, a few candles later another bearish reversal pattern appears, and this time a new trend, a bearish one, forms. From this moment on, one should look to ride the newly formed trend using the method explained earlier.
The beauty of this indicator comes from the fact that the two methods described here work on any time frame the indicator is applied to. If you are a scalper, then the Bollinger Bands indicator is your friend regardless of whether you’re applying it on the 1-minute or the 5-minute chart; the same principles are valid on any time frame. If you are a swing trader, and your time horizon for a trade spreads from a few hours to days and even weeks, then the Bollinger Bands indicator can easily spot reversal points and levels to add to a trend. No matter what type of trader you are, or what trading style you use, the Bollinger Bands indicator is a valuable tool for every trader’s kit.
Other educational materials
- Overbought and Oversold Areas in Ranging Markets
- Profit from DeMarker Divergences
- Correlations Between Different Currency Pairs and Other Markets
- What is a Margin Call?
- Setting Up a Chart in Metatrader 4
- Forex Trading Accounts and the Value of a Pip
Recommended further reading
- “Black–Scholes’ model and Bollinger bands.” Liu, Wei, Xudong Huang, and Weian Zheng. Physica A: Statistical Mechanics and its Applications 371, no. 2 (2006): 565-571.
- “Using Bollinger bands.” Bollinger, John. Stocks & Commodities 10, no. 2 (1992): 47-51.
Related Articles