Welcome to this weekly review powered by TopRatedForexBrokers.
Global Stock Markets
A great week for the Global Stock Markets with all major indices finishing the week higher. The earnings season is looking strong so far in the US, with the American markets leading the way economically. The best performer this week was NASDAQ, which gained 2.29%, and the S&P 500 also reached fresh new highs this week.
Commodities
For commodities, crude oil closed flat, while the gold and silver markets dropped a little. Platinum was by far the biggest winner of the week, gaining more than 4%.
Platinum has broken out on the weekly chart and perhaps should lead the way for other metals.
Currencies and crypto
With currencies, the US dollar gained against most currencies apart from the Swiss franc.
Cryptocurrencies had an excellent week, with gains across the board. Bitcoin Cash was by far the biggest winner, gaining 40.59% for the week. However, Litecoin gained over 25%, while Ethereum gained roughly 19%. The least gains were seen in Bitcoin, but even that was more than a 10% gain.
That’s it for another weekly review. From all of us at TopRatedForexBrokers, we’ll see you next time.

- Gold markets in large flag
- Fibonacci ratios holding
- 50 day EMA moving at speed
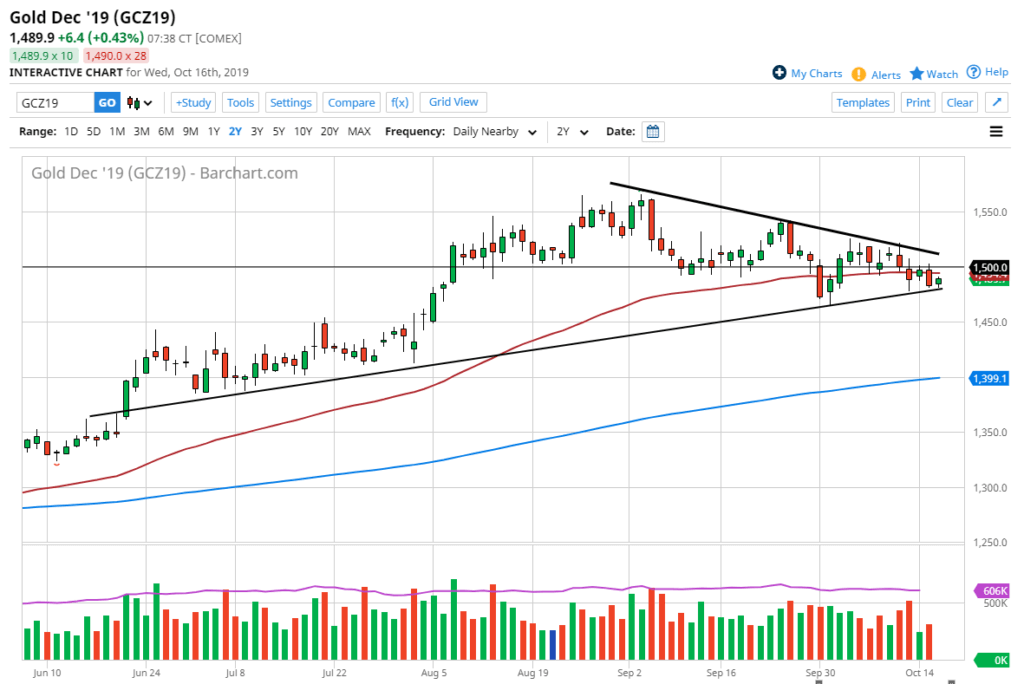
Gold markets have been very active this year. They were gaining quite drastically until the last several weeks. Perhaps the pullback has been more or less a bit of digestion. The month of August alone was worth 15% in gains. That’s a huge move in any market, let alone Gold which is one of the larger contracts traders get involved with.
Trendlines
There are several trendlines worth paying attention to in the market. Not the least of which would be the two that make up the flag marked on the chart. Ultimately, the market will need to make a decision. While the flag is of the bullish variety, that doesn’t necessarily mean that it has to breakout. However, there are strong arguments to be made for breaking the top of it. This would be a very bullish sign, perhaps sending this market to $1650. After all, it would, in fact, be a clearance of a downtrend line. The measured move of the flag pole suggests that level as a target.
Other technical factors
There are other technical factors to take into account as well. The 50 day EMA is currently slicing through the last several candlesticks and flattening out. This is rather bullish when you think of the fact that the larger technical pattern is negative. As long as the 50 day EMA doesn’t slope lower, it does show the possibility that the market could break out. If that’s going to be the case, then the $18.75 level would be an area of interest as it was a recent high that tested that trend line. Ultimately, that would be the initial target on a breakout to the upside.
Another thing to pay attention to is that the market has accepted the 38.1% Fibonacci retracement level as support as seen by this triangle, so a break higher from here would tie-in quite nicely with Fibonacci trading in general. That being said, the exact opposite can be true as well, if that level gets broken it would signal much more bearish pressure in this market and have traders selling.
External factors
Keep in mind that the precious metals markets are often influenced by geopolitical concerns, and economic growth or weakness. There are a lot of things to worry about in general right now so the fact that precious metals could take off to the upside would not be a huge surprise.
The market has been in a long term trend to the upside for several different reasons, not the least of which would be central bank easing which shows no signs of slowing down. Just last night the Bank of Japan suggested that much more quantitative easing was coming out of that central bank, and the Federal Reserve, of course, is set to start cutting rates again in October. That being said, gold should have a relatively strong case for buying ahead. However, waiting for that downtrend line is going to be crucial. Otherwise, the market could break down rather drastically if the triangle kicks off, but so far it has avoided that.
- Major trend line holding market up
- Longer-term uptrend in sight
- Central banks continue to ease policy
Gold markets rallied a bit during the trading session on Wednesday, and we continue to see the uptrend line hold the market higher. It looks as if the gold markets will continue the overall uptrend, but the 50-day EMA just above could come into play. If that’s going to be the case, it’s likely that the next few days will be rather crucial.
Choppy turnaround?
Looking at the area that the market is in right now, it features not only an uptrend line, but also a couple of hammers in this general vicinity. With that being the case, it’s likely that buyers will be somewhat aggressive. There are also plenty of things out there to throw the market around.
At this juncture, the uptrend line will be crucial to pay attention to, and as long as the market is above that line, there is the possibility of holding an upward attitude.
Regardless, with the 50-day EMA just above and the wicks at the top of the previous handful of candles, the market should find some selling pressure. Ultimately, this is a market that will be news-driven more than anything else, as gold is considered to be a “safety market”.
Gold technical chart
The market going forward
The most important thing to pay attention to here is the overall trend. One must also note that the most recent value area has been found near the $1510 level, which means there are plenty of traders interested in the market in that area, providing a bit of upward pressure as well. It should also be pointed out that there is a little bit of a “gap” in volume above, and that should allow gold to rally rather quickly.
If the market was to break down below the uptrend line, it could open up the gold market to the $1450 level. This area has seen resistance in the past and could offer support based on the mid-century mark and, of course, the fact that it should bring in “market memory”.
However, it should not be forgotten that there are central banks around the world that continue to ease monetary policy. Naturally, there is a significant amount of fear when it comes to Brexit, the US/China trade relations, tensions in Syria, and a whole host of problems that could have money looking to gold for safety.
Buying on dips should, in theory, continue to work out. This is because, although lately the market has pulled back significantly, that was probably necessary to continue the overall upward momentum in a market that has been very bullish for quite some time.
- Silver back above 50-day EMA
- Recovering nicely after initial pullback
- Currently in major wedge
- Central banks should continue to support
Silver markets have been rather choppy over the last several sessions, but they were especially interesting on Tuesday. We initially thought the market would drop below the 50-day EMA, but we saw it turn around and recover again. The market has been hovering above an uptrend line for some time, but recently it has seen a bit of a downtrend line push lower. This builds up inertia, which of course leads to explosive movements.
Continued uncertainty
There is continued uncertainty around the world. That does help precious metals markets overall as it offers a nice way to look for safety. As the silver market tested the $17.00 level underneath, it found quite a bit of support, which is a good sign for the longer-term. Ultimately, the $18.00 level should offer resistance. As a result, if we were to break above there, it could continue to push this market to the upside.
As uncertainty increases with such things as the US/China trade talks, and of course the disappointment that will almost certainly bring this week, it makes sense that silver will be looked at as a potential safe haven. Beyond that, central banks around the world continue to cut interest rates in what is a slowing environment, as far as global growth is concerned. That helps precious metals as well, as fiat currencies have a major “race to the bottom.”
Technical setup
The technical setup in this market so far has been quite easy: you simply look for value and take advantage of it. Right now, as we are close to the 50-day EMA it’s likely we will continue to find buyers on perceived value. Longer-term, the market has pulled back quite nicely; after a 15% gain in the month of August, it was probably needed. Quite frankly, it would take some type of major switch in the fundamental setup to cause this market to fall apart.
To the upside, I fully anticipate that silver markets will see the $20 level over the next several months, especially as it becomes obvious that the global situation is getting worse, not better. Ultimately, the $18 level is a minor barrier that could cause some issues over the next couple of days. However, building up a position over the longer term makes quite a bit of sense. Although gold markets are rather volatile, they can be quite profitable as they tend to trend over the longer term quite nicely. By the end of the year, we should see a $20/ounce price print.
Longer-term, the market will probably go much higher than that, given enough time. However, the $20 level will be psychologically important, so obviously we are setting up for a huge battle in that area once we get there. Now that value has returned to the market, longer-term money seems to be flowing in.
- Crude oil markets continue to face demand destruction
- Saudi production back to full capacity
- Break of support could lead to a big move
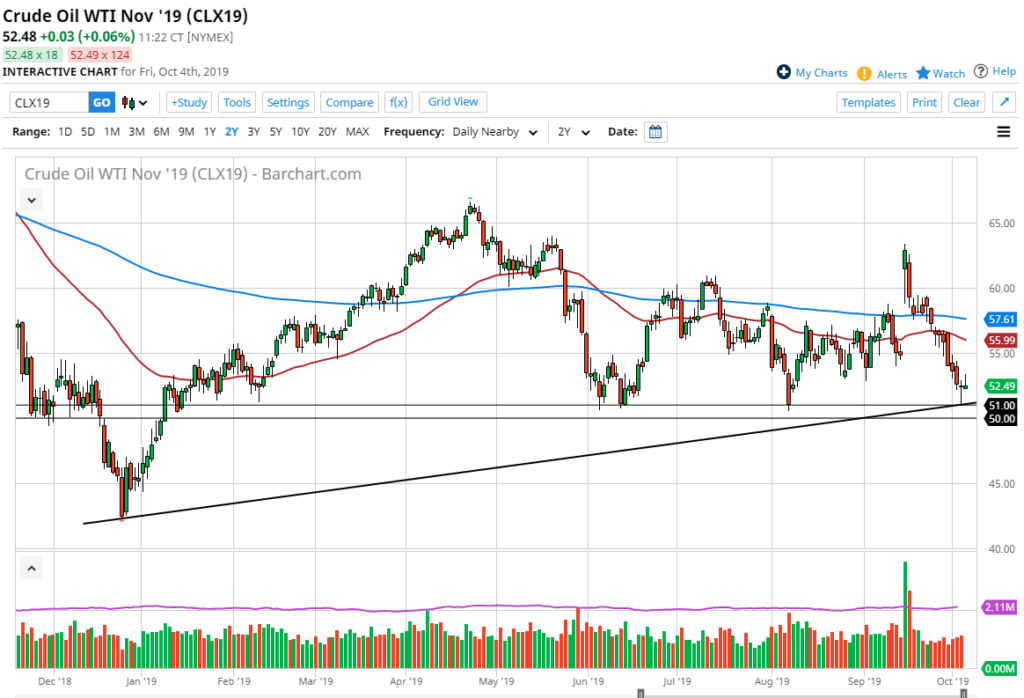
The West Texas Intermediate Crude Oil market has initially tried to rally during the trading session on Friday, but it has turned around to show signs of weakness again. As we had formed a hammer during the trading session on Thursday, it could be thought that a bounce could be coming. However, that has failed to materialize, or at the very least, it has failed to stay intact. Ultimately, this foretells potential moves to the downside.
Major confluence of support
There is a significant amount of support to be found just below, as made evident by the hammer that formed on Thursday. The $51 level was where the market stopped and turned around, but it is also the scene of a potential uptrend line. Furthermore, there is a thick “zone of support” that has held this market higher for some time. Now that the drone strike news has abated, it looks as if we may be running out of steam based on the shooting star being formed after the reactionary bounce.
At this point, a break down below the $50 level would, of course, be very bearish, and could open up the floodgates for a larger move to the $45 level. Keep in mind that we have already wiped out the gap from the drone strike in Saudi Arabia, so it’s obvious that the markets are extraordinarily bearish. By blowing through that gap, it means we are actually worse off from a pricing standpoint than we were before the attack.
Fading rallies
The market could rally from here, and the fact that the daily candlesticks over the last 48 hours will form a hammer and a shooting star suggests we are going to try to build up enough inertia to make a move. If the market breaks to the upside, the 50-day EMA painted in red on the chart will more than likely be the first technical barrier of significance, although market participants could see some selling pressure at the psychologically important $55 level. It probably makes the most sense to look for a daily shooting star or some type of bearish candle and take advantage of it.
October 4 oil chart
Demand uncertainty
The biggest issue that crude oil faces right now is that demand has been falling. The inventory numbers coming out of the United States have been showing large builds, meaning there is a lot less in the way of demand. With that, it’s very likely that the bearish pressure will continue, and that will be especially true if the US does in fact slow down. There seems to be a serious lack of demand from other parts of the world, including China and the European Union, which of course puts bearish pressure on energy in general.
- Choppy but still in a downtrend
- Below two major moving averages
- Likely to continue lower given enough time
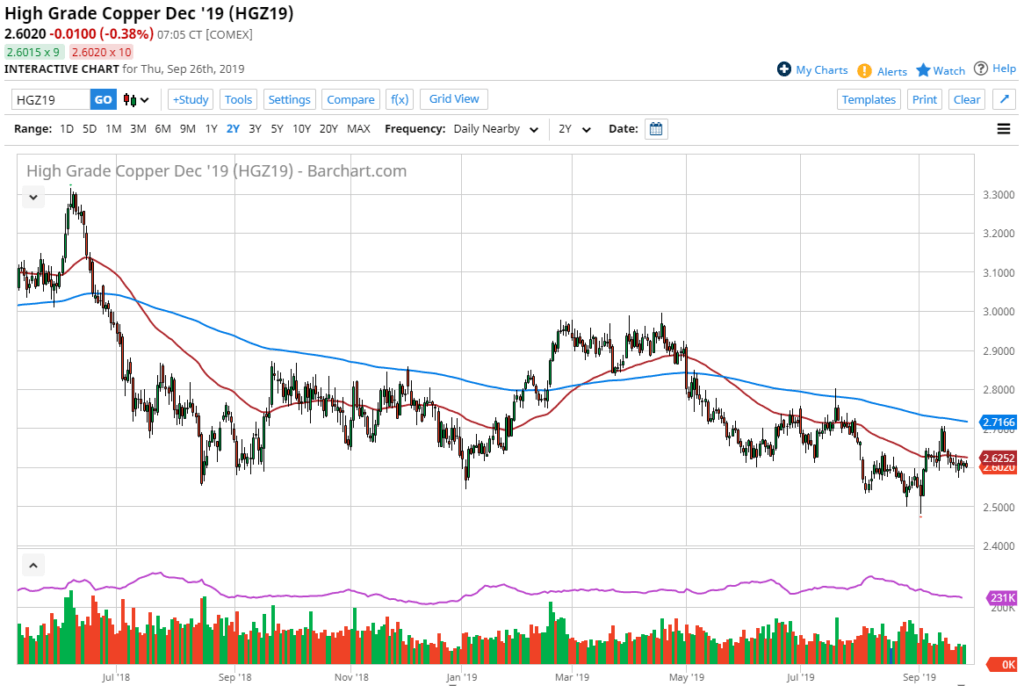
Whether you know it or not, copper is one of the most important commodities to follow for those navigating the global markets. This is because copper is highly sensitive to economic headwinds and tailwinds as it is used in multiple situations, including construction and manufacturing. Simply put, the stronger an economy is, the more likely it is to need copper for a multitude of reasons.
Longer-term downtrend
Copper futures daily chart
The longer-term downtrend in the copper market is still very much intact, but it should be noted that the market has also been very choppy in general. Because of this, it has probably put quite a few traders to sleep out there, unless they are longer-term. The short-term back-and-forth type of range-bound trading has worked quite well in this market, but the one consistent factor has been that there are plenty of sellers willing to pounce on any signs of strength. This is a somewhat ominous sign for a lot of the global economy, as horrible economic figures in China have weighed upon the idea of growth.
Moving averages
There are a couple of major moving averages that are turning lower, or at least acting as dynamic resistance. The 200-day EMA is currently trading near the $2.70 level, while the 50-day EMA is just above current trading. The last several months have seen these two moving averages act as a bit of a barrier for the buyers to try to get above. With that being the case, it makes sense that sellers will continue to look at this as a potential tool.
The trade going forward
The trade going forward in copper is going to be a bit of a mixed bag, although it certainly looks as if the downside continues to be the favored trade for the overall market, due to there being plenty of concerns around the world to keep traders a bit bearish. In fact, quite a few traders will equate the copper market to China itself. Paying attention to the Chinese figures which have been getting worse is probably the best way to go, going forward.
Another thing to keep in mind is the latest headlines coming out of the US/China trade negotiations. While they have settled down a bit, the reality is that the United States and China are light years away from each other when it comes to the idea of working out some type of deal. As long as that’s the case, it’s very likely that copper will continue to find plenty of sellers. Currently, it looks as if the market breaking below the lows of last week opens up the door towards the $2.50 level. This is a large, round, psychologically significant figure that should offer some support.
- Gold approaching support level
- Bottom of massive rectangle
- Moving averages still going higher
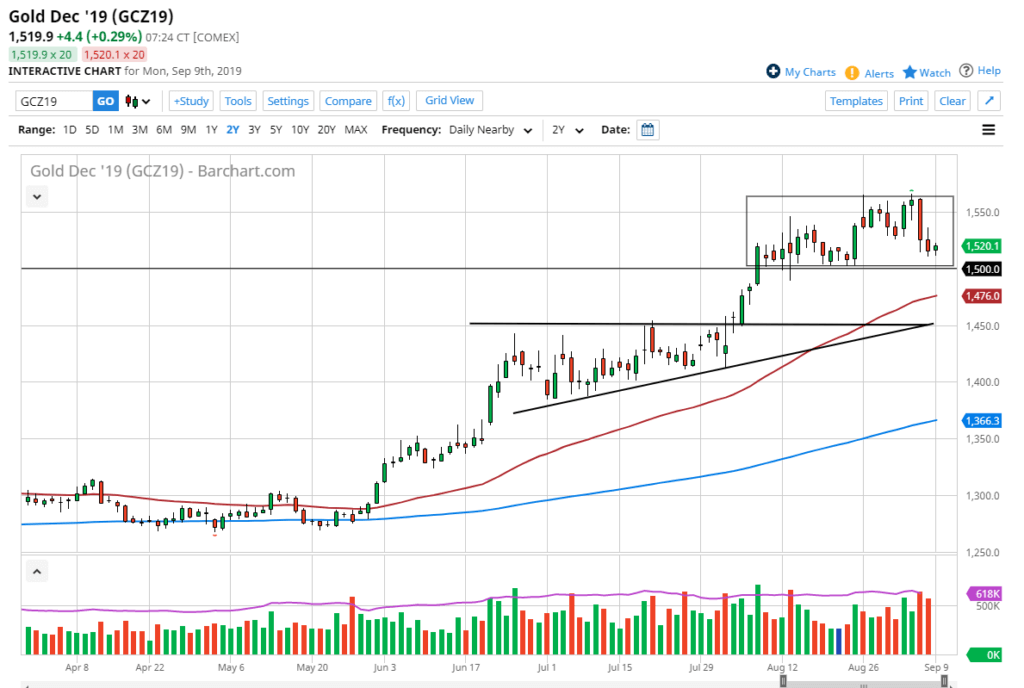
Gold markets found a little buying pressure early on Monday as they approached the crucial $1500 level. There is significant support at that level, not only from a psychological standpoint, but from a structural one too. Ultimately, this is a market that continues to attract a lot of inflow with the recent longer-term uptrend. With that being the case, it’s very unlikely that sellers will gain any significant traction.
Gold will continue to act as a buffer against global concerns of slowing growth, the US/China trade war, Brexit, and a whole host of other issues. It’s highly plausible that gold markets will continue to be one of the favorite trades for traders around the world.
Capital controls and broken resistance
Keep in mind that there are capital controls people will need to deal with in places such as China and Venezuela. So, gold ends up being one way to protect wealth in a situation such as that of Hong Kong, or the economic meltdown in Venezuela. Gold will continue to go higher for the longer term, simply because we have broken through so many resistance levels underneath. Ultimately, this is yet another confirmation of just how strong this market will be, and therefore a lot of traders will be active due to a “fear of missing out”.
Moving averages
Moving averages come into play for longer-term traders. The 50-day EMA is sitting at the $1475 level, and then even lower at the 200-day EMA at the $1366 level. Overall, there are plenty of reasons to think that support will come into play even if we were to break down below the $1500 handle. Furthermore, we also have an uptrend line that is underneath near the $1450 level, so it’s likely that we will see plenty of reasons to “buy on the dips” if this does become the case.
Gold Chart Analysis, September 9
Gold going forward
Going forward, gold should continue to rise for the longer term. Not only is it a hedge against global and geopolitical uncertainty, but it’s also a way to deal with central banks around the world cutting interest rates and loosening monetary policy. In the end, that’s probably the biggest driver, but they all point in the same direction: upwards.
Looking at this chart, we have seen a significant pullback, but it is a short-duration selling and what has been a longer-term buying opportunity. The $1500 level could be a good opportunity for longer-term traders to buy gold, as you don’t want to “jump all in” in this area. If the trade works out and goes higher, it’s very likely that we continue to go higher, perhaps reaching towards the $1550 level, and then eventually clearing that level and reaching towards the much higher levels that we have seen in the past, with the $1600 level being the first major barrier. All things being equal, this is a market that will continue to find plenty of interest.

