Welcome to this week’s market roundup brought to you by TopRatedForexBrokers.
Global equity markets witnessed a heavy sell-off last week, as the rapidly spreading new coronavirus cases outside China fueled concerns of a global economic slowdown.
UK markets ended in negative territory, led by losses in consumer discretionary and energy sector stocks.
Currencies
On the currencies side, the USD ended mostly higher against its peers, after the US new home sales rose to its highest level since July 2007 in January.
The EUR ended higher against the USD, after the Eurozone consumer confidence advanced in February.
The GBP ended lower against the USD, after Britain threatened to walk away from the trade negotiations with the European Union if there is no progress by June.
Commodities
Gold prices fell last week, as strength in the US dollar drifted investors away from the safe-haven commodity.
Brent oil prices also fell, as a jump in the number of coronavirus cases in Europe and the Middle East raised fears over the crude oil demand.
Cryptocurrencies had another difficult week, with most major currencies seeing heavy losses across the board.
That wraps up another weekly market update. See you next time.
- Massive amount of negativity in the markets
- Gold a safe-haven asset
- Coronavirus, trade war, and loose monetary policy
The one thing that the markets have seen a constant diet of has been concerns. There are plenty of reasons why traders have been afraid of the global markets. Therefore, as the gold markets are considered a safe haven at times, gold has enjoyed quite some inflow.
The situation for gold is a “perfect storm” as the factors that typically push this market higher have all been in alignment lately.
A host of issues
There is a whole host of issues (as gold traders can tell you) as to why gold should continue to rally. The first and most obvious reason is that it’s in a technical uptrend to begin with.
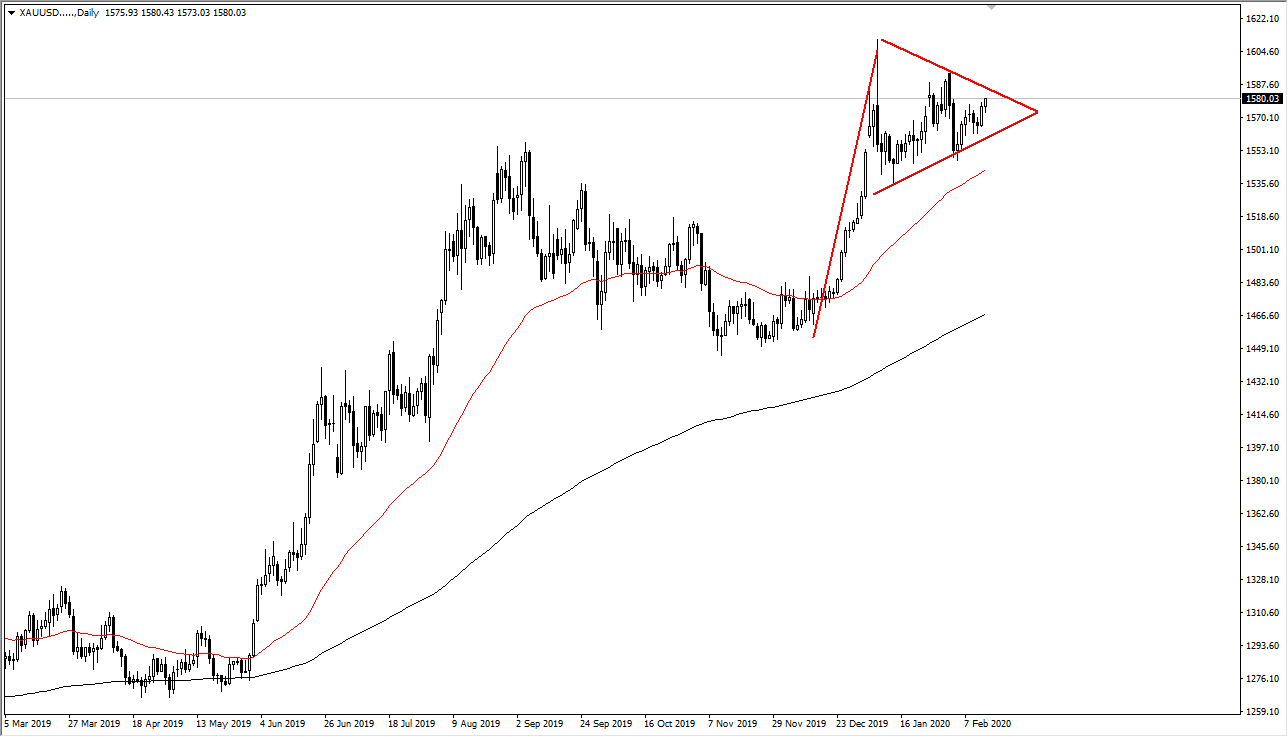
Looking at the price, it is coming close to the $1585 level, which is a potential downtrend line for a pennant. Ultimately, this is a market that has been rising for some time, as the reasons for a strengthening gold market seem to be continuous.
To begin with, central banks around the world keep a very loose monetary policy, devaluing fiat currencies. That makes gold rise in value against currencies. The gold market against the US dollar has been rising as well, showing extraordinarily bullish pressure, as the US dollar itself has been strong. The fact that gold can rally against it tells you just how strong it truly is.
The coronavirus has caused a lot of issues as well, which would be the latest reason that gold has rallied due to the concerns over a global slowdown. By owning gold, the idea is that the investor can protect their portfolio against the massive amount of volatility in loss in riskier assets. That being said, gold has reacted to the virus quite stringently.
Furthermore, gold had been in a rally due to the US/China trade war, as the concerns about global markets slowing down were a major issue.
In other words, there has been a constant barrage of negative headlines that continues to push money into this market.
Technical analysis for gold/USD
Gold vs. US dollar chart
The technical analysis still favors the gold market to go higher. The market is in a bullish pennant, with the 50-day EMA underneath offering some support.
The market could go as high as $1750, as it is the measured move from the pole of the technical pattern. This should continue to bring technical traders in as well.
As long as gold can stay above the red 50-day moving average on the chart, it’s very likely that there will be more upward momentum. That should send this market looking towards that longer-term target.
Even if some of the other issues abate, the central banks around the world and their loose monetary policy will continue to drive gold higher.
- Wall Street rallies significantly
- Gold plummets in risk appetite return
- Gold to offer value
During trading on Tuesday, Wall Street has been in a buying frenzy. Clorox gained 7% and Tesla an astounding 15% on the back of a 20% gain during the previous session. Now, the S&P 500 is almost 2% higher than it was at the opening, as more of a “risk-on” move has come into the markets.
Recently, there have been concerns about global supply chain disruption and a strengthening of the coronavirus outbreak. Now, it looks as if Wall Street is willing to look past that, perhaps in a bid to shelter money from Asia as well.
Quite often, as Asia falls apart, money comes back to the United States or leaves Asia to find the safety of American indices (in the case of foreign investment). Either way, the volume is strong on Wall Street during Tuesday trading, as the S&P 500 has broken above the 3300 level again.
Gold plummets
Gold yearly chart
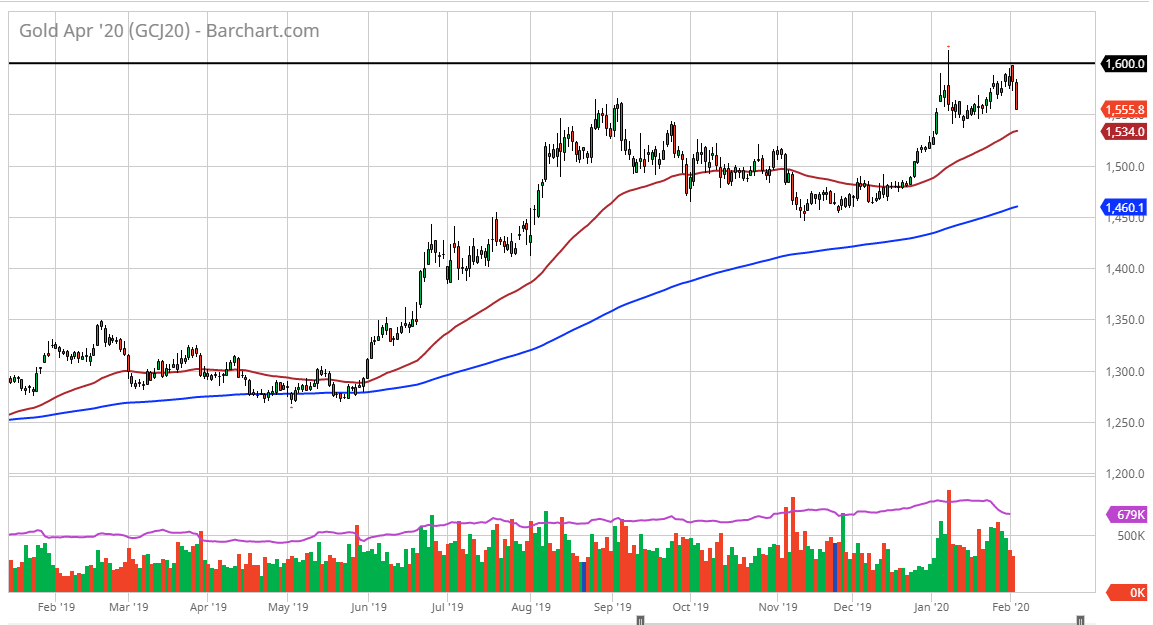
Gold, the long-term champion of safety, has been hit rather hard during trading on Tuesday, with traders willing to take on more risk. April 2020 futures markets, the forward market, have fallen as low as $1555 at noon in New York. The $1550 level just below should offer a certain amount of support, based on previous action.
Furthermore, the 50-day EMA is coming into the same area, so it is possible that a certain amount of technical support should show itself. However, as gold has dropped 1.7% during the day, it looks as if until there is some type of reason to run for safety, gold will probably be on its back foot.
Furthermore, US Treasuries have sold off as well, bringing in higher yields. This is a sign of more risk appetite coming back into the marketplace, and with the strength of Wall Street, it is difficult to envision that much gold will be bought in that environment.
Facing difficulties
Going forward, it is obvious that it will be very difficult for the gold markets to break above the $1600-an-ounce level. This is the third opportunity to break above there, and if gold does slice through that level, it would be a sign that is going to go much higher. In the short term, though, it’s very likely that gold will continue to suffer at the hands of risk appetite coming back into the marketplace.
Beyond that, bad news coming out of Asia could also have gold rallying significantly, as the coronavirus continues to spread all across the region. The number of infected people continues to climb, which cannot do much for risk appetite over the longer term.
In the short term, it does look as if gold is going to pull back in order to offer a bit of value for those who are patient enough.
- Middle East tensions flare
- Economic uncertainty
- US dollar takes a hit
- Gold markets likely to go higher
To kick off the week, we have seen gold shoot straight up in the air. This is not much of a surprise considering that on Friday, the United States killed a top-level Iranian general in retaliation for several other minor attacks in Iraq.
Since then, a lot of chaotic action was witnessed around the world. When traders see this many things potentially going wrong at the same time, it’s very common for them to buy gold, as it can offer some safety.
Resulting uncertainty all around
The attack on a US base in Kenya over the weekend shows just how widespread the chaos could end up being, as retaliatory strikes against the United States are almost certain to begin. President Donald Trump has warned that any aggressive action by the Iranians would warrant an “excessive retaliation.” With that, while the Iranians are grieving the loss of General Suleimani, various extremist groups around the Middle East will be targeting US interests.
In other words, the situation will go far beyond just the United States and Iran. The attack in Kenya was carried out by terrorist group Al-Shabab, which has its roots in Somalia.
Now, the Iranians will have to save face by retaliating, while being careful not to do too much to provoke a full-blown war with the United States – something it cannot win.
It should also be noted that there is some economic uncertainty out there. The United States dollar has taken a hit over the last couple of days against several of the other major currencies, such as the euro, the pound, and the Australian dollar. This in itself can provide a measure of upward pressure in the gold markets.
Technical analysis for gold
Monthly gold chart
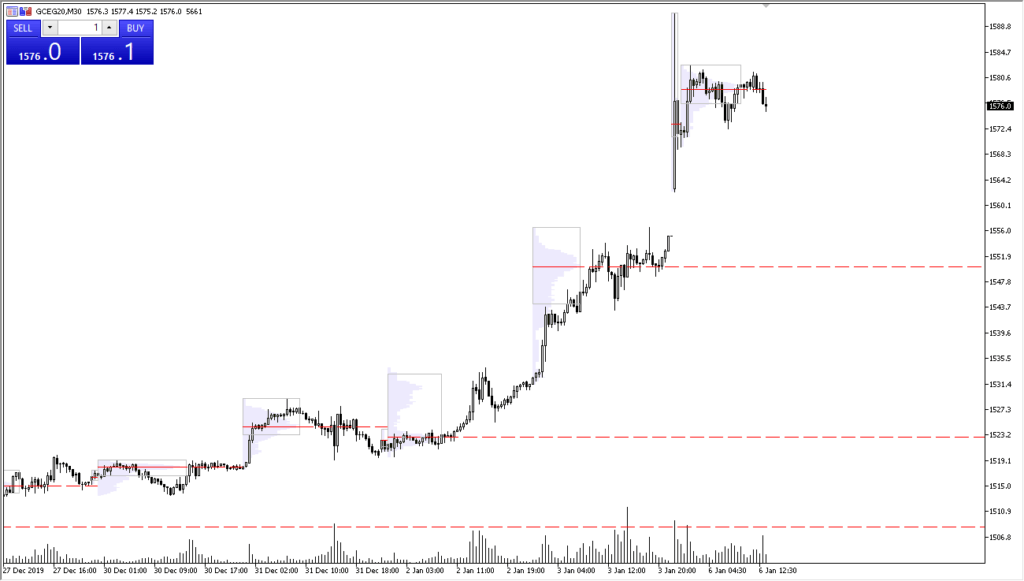
Gold futures gapped higher to kick off the week, reaching as high as $1590 before pulling back a little. The market has been finding some trading volume near the $1580 level, but the gap has yet to be filled. More than likely, the market will pull back to fill that gap, which is closer to the $1555 level, where the “point of control” from volume profile trading on Friday will offer support.
Gold markets have taken off to the upside and look very likely to continue going higher. $1600 is most certainly within the realm of possibility in the short term, with a longer-term target closer to the $1800 level based on longer-term charts. A pullback should continue to offer plenty of value, and it will probably be some type of Iranian retaliation that drives gold higher.
In the meantime, the market simply waits to see how the Iranians will react.
- Gold markets rally into the new year
- Recent breakout
- Confirmed retest of support
- International atmosphere major influencer
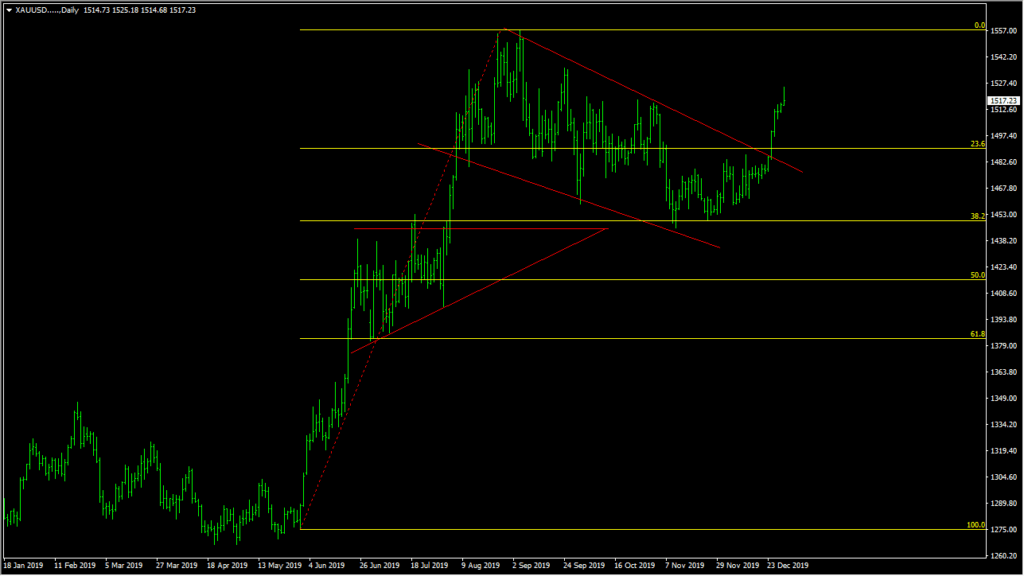
During 2019, there has been a “two-speed market” when it comes to the gold markets. There was an initial shot straight up in the air, reaching towards the $1550 level before pulling back for several months, forming a down trending channel. This put the market back to sleep but eventually, it reached towards the 38.2% Fibonacci retracement level, at the crucial $1450 level. That level was previously the highs from an ascending triangle and forms the future picture for Gold in 2020.
Plenty of reasons for gold to rally
The gold markets should get a boost for plenty of reasons going into 2020. This is a market that has a lot of different possible catalysts for moving. On the one hand, gold does rally due to a softer US dollar, but it also could be due to people running toward safety. In this sense, there are a couple of different scenarios that should continue to benefit gold going forward.
The US dollar has lost a bit of steam against the major currencies such as the Euro and the Aussie. It should give a boost towards the gold market, as it is priced in US dollars, at least in the most liquid forms. If the US dollar continues to soften, that should provide a little push for gold to go higher. The Federal Reserve continues to offer repo operations. With softer than usual economic numbers coming out of the United States, there is the possibility that the Federal Reserve will have to loosen monetary policy. If that is going to be the case, it’s very likely that the gold markets will react as well, moving higher.
Other Factors
The Americans and the Chinese have suggested that a “Phase 1 deal” is getting ready to be signed on January 15, and that is bullish for risk appetite. However, if there will be some type of setback or if “Phase 2” is going to take more work, then gold is likely to rally as well. There are also plenty of other concerns when it comes to various hot spots around the world, such as Turkey, Venezuela, North Korea, and of course any tensions in the Middle East. In other words, there are plenty of actors out there that could cause issues.
Going forward
Gold daily chart
Going forward, it’s very likely that the market is ready to go higher into 2020, and longer-term investors will more than likely not only hold onto gold but look at dips as buying opportunities. At this point, gold looks as if it is very likely to continue gaining strength in the new year, and therefore could be one of the better-performing assets. Gold will continue to move right along with the plethora of headlines that are sure to cross the wires.
- Major downtrend line broken
- Moving averages turning higher
- $1500 just above
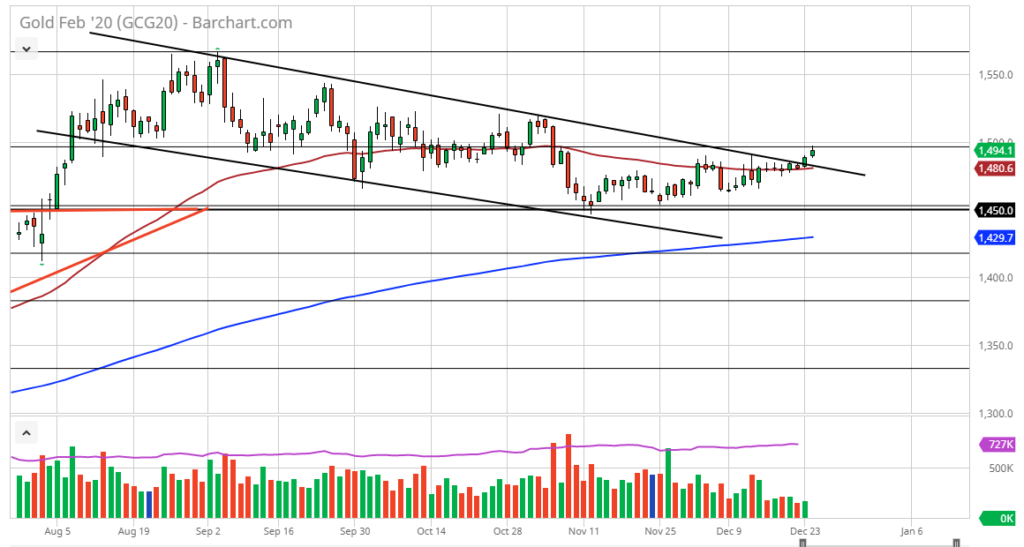
The gold markets rallied significantly during the trading session on Tuesday, going into the Christmas holiday. We did not break above the $1500 level right away, but it does look like an area that we will be challenging. That level being broken to the outside should send this market much higher, as it is a psychological barrier. Ultimately, gold is a reflection of both the US dollar and sometimes a reflection of risk appetite in general. It has been trying to reach higher, and we are likely to continue the longer-term uptrend that we have seen.
Technical Analysis
Gold chart
Data shows that gold markets have rallied significantly during the trading session on Tuesday, which is interesting considering the volumes are low and it has allowed traders to finally break out of the descending channel that you see on the chart. The $1500 level is a psychologically important level, and if we can break above there then it should bring in fresh buying. In the meantime, if the market pulls back, there are a couple of things that could keep it somewhat lifted. The 50 day EMA is curling higher and it looks as if it is starting to offer dynamic support. The downtrend line should also be supportive, as resistance then becomes support.
To the upside, if we do break above the $1500 level it’s likely that the market goes looking towards the $1520 level next. That’s an area that should offer resistance, but after that, it’s likely that the market then goes looking towards the $1550 level next. Ultimately, this is a market that looks ready to continue the longer-term uptrend, as the support at the $1450 level has been showing itself to be supportive. Plus the 38.2% Fibonacci retracement level is found there as well. The fact that the market pulls back to the 38.2% Fibonacci retracement level and then bounces shows just how strong the longer-term uptrend could be. With that in mind, it’s very likely the gold has further to go.
The trade going forward
The trade going forward with gold is to simply buy pullbacks as they will then give you an opportunity to pick up a bit of value. As long as the market can stay above the 50 day EMA it’s likely that the market will continue to go higher.
To the downside, it’s not until we break down below the $1450 level that the market would be showing signs of exhaustion and a potential breakdown. Ultimately though, it does look as if gold is ready to go higher, perhaps even for a longer-term move towards the highs again.
- Gold markets relatively flat
- Holidays weigh upon volume
- 50-day EMA acting as a magnet
During trading on Thursday, the gold markets were flat yet again, as we have seen all week. This isn’t much of a surprise, because there are a lot of moving pieces right now and there a lot of different things coming into focus at the same time.
Multiple factors influencing the gold markets
There are multiple factors affecting the gold markets right now, as well as many of the other markets around the world. At this point, the majority of market participants are paying more attention to the holidays than what’s going on in the markets, and this is reflected in the lack of movement.
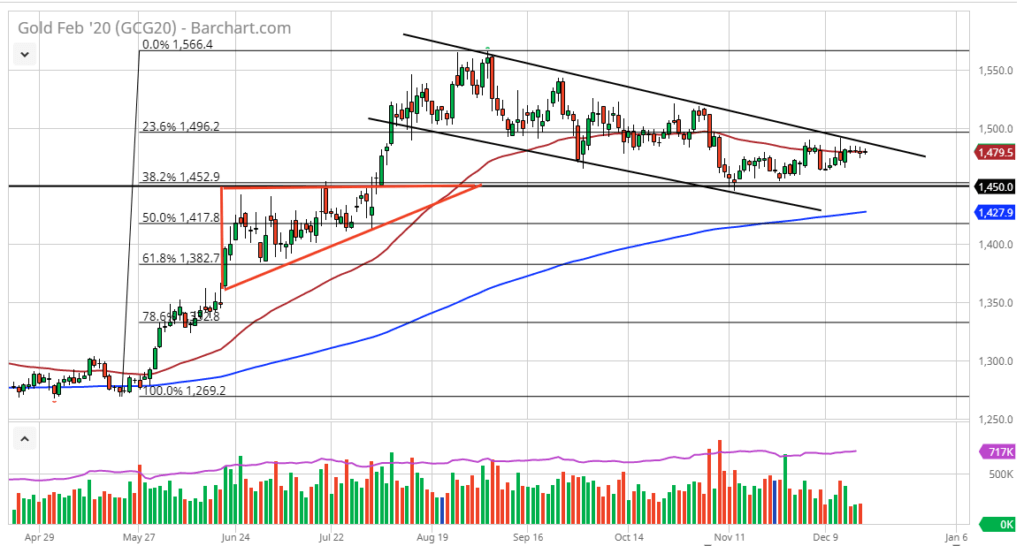
The technical analysis suggests that the down trending channel is still in play, and it looks as if the gold market simply has nowhere to be. That’s because of the 50-day EMA and the downtrend line at the top of this channel. There are a lot of things going on at the same time that could keep this market soft.
Gold chart
Underneath, there is the $1450 level which has been a massive support lately. Recently, the market has been using that level as a “floor”, and with the multitudes of problems out there, it makes sense that gold would have a little bit of support somewhere. This is also the 38.2% Fibonacci retracement level from the previous move, and this little pullback is probably healthy for the longer term uptrend.
Beyond all of this, gold has been doing nothing against the backdrop of the US/China trade deal. Granted, there has been a potential breakthrough in the idea of a “Phase 1 deal”, but it seems very unlikely that we are going to get any type of clarity in the short term. After all, the deal has been light on details, and for that matter has been very quiet since the announcement. It’s as if the “risk on/risk off” attitude of gold shows just how the market feels right now, in a state of confusion.
Going forward
Going forward, it’s very likely that gold will try to make a breakout from here. At this point though, it needs some type of catalyst and right now it doesn’t exist. The support level at the $1450 handle is extraordinarily strong, and therefore it makes sense that we would continue to see this level be respected by the market overall. Therefore, a bounce makes more sense than not from a technical standpoint. All it takes now is some type of negative headline out of the US/China situation, and gold will be poised to take off to the upside. In the meantime, the next couple of weeks might be relatively quiet without that.
- Major Fibonacci retracement level just under price
- 50-day EMA just above
- Geopolitical concerns abound
- US-China situation persists
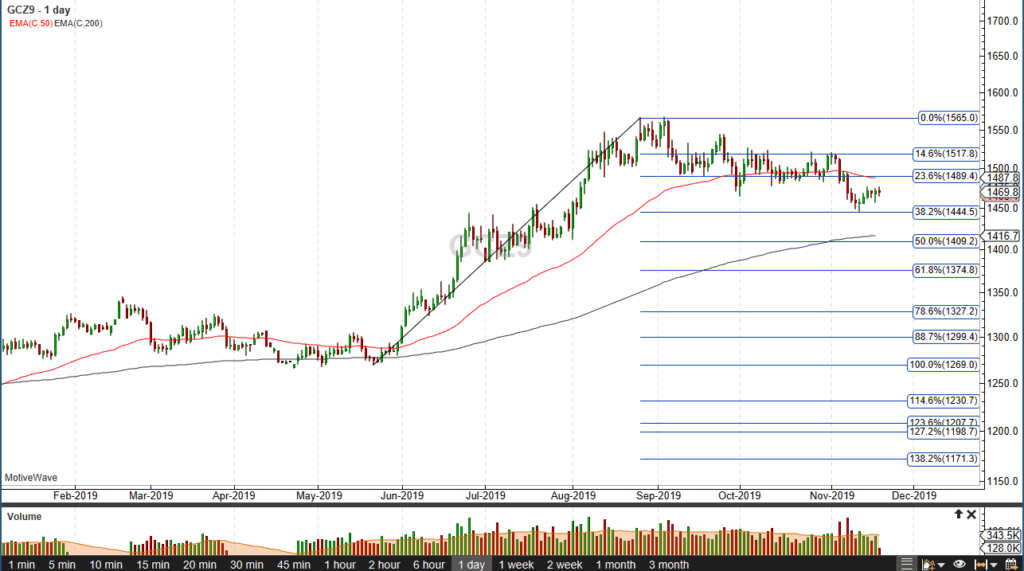
Gold markets have been slightly negative to kick off the trading session on Tuesday, but they are still finding plenty of support underneath, based upon a whole plethora of technical reasons, with the most obvious one being the 38.2% Fibonacci retracement level at $1445. Beyond that, there is also plenty of support upon the top of the ascending triangle. This had previously kicked off the latest leg higher, which is closer to the $1450 level.
Geopolitical concerns
The geopolitical concerns around the world will continue to offer plenty of momentum for gold markets. At this point, the market is starting to see a lot of concerns when it comes to the US-China trade situation. That’s because there are plenty of headlines crossing back and forth and, in both directions, as far as being both positive and negative. Gold will be used as a hedge against that kind of volatility from the concerns surrounding a global slowdown due to the trade war.
Beyond that, there are worries about global growth in general, as it has been slowing down. Ultimately, it looks as if there are a lot of mixed signals out there with central banks around the world loosening monetary policy and one of the biggest culprits being the European Central Bank not tightening anytime soon.
The trade going forward
Gold daily chart
The trade going forward in this market is simply to look for value when it appears. This is most easily defined on the chart by looking at short-term pullbacks as buying opportunities, while the market is trying to build up momentum to continue the longer term uptrend.
There are plenty of reasons to think that gold goes higher longer term, and based upon what we have seen so far, every visit of the highs would not be out of the question. Looking at this chart, the 200 day EMA sits just below the $1450 level as well, and longer-term traders will continue to pay attention to that as per usual. Once both of those support levels give way, then you could be looking at a move down to the $1350 level. Although this would more than likely coincide with some type of very bullish “risk on” type of economic news or perhaps a development between the Americans and the Chinese. Currently, that looks to be very unlikely so gold should continue to attract plenty of order flow.
- S&P 500 still at all-time highs
- Crude oil continues to find buyers
- Gold crushed
- Bond markets sold off
Lately, we have seen more of a “risk-on” type of trading environment. The marketplace tends to move in highly correlated fashions, so keeping an eye on this can help trading, regardless of which market one specializes in.
For example, the USD/JPY pair is a highly sensitive currency pair when it comes to risk appetite. It tends to rise when traders are willing to take a bit more risk, as the Japanese yen is considered to be a major “safety currency”.
Stock markets
The global markets, as far as equities are concerned, have been doing quite well. It’s no secret that the United States stock markets have been very positive for some time, but we are starting to see some signs of hope in Asia as well.
In China, it looks as if the stock market is getting ready to break out, which would be a major boon for a “risk-on” type of trade going forward. That being said, the S&P 500, one of the major benchmarks for traders around the world, is still close to the all-time highs. Therefore, it has to be looked at through the prism of healthy earnings through that index.
Crude oil
The crude oil markets are all over the place, but when seen from a longer-term perspective, they are simply consolidating. Using the West Texas Intermediate Crude market as a benchmark, it’s plain to see that the market is hanging about between the $50 level on the bottom and the $60 level on the top.
This is typical behavior for the crude oil market as it does tend to be very technically driven. But at the end of the day, what it does show is that there are numerous headwinds and tailwinds at the same time out there for the global economy.
While the market is somewhat consolidating, what it tells us is that there isn’t exactly panic out there. Considering the oversupply of crude oil, that’s pretty significant as we are treading water.
Gold
The gold market has been sold off rather drastically. This is probably the biggest “risk-on” type of signal that has been shown in the marketplace lately. By selling off the way it has, it shows that traders aren’t trying to find as much in the way safety as they had been previously.
Granted, gold markets are still in an uptrend, but they certainly have taken quite a bit of a break recently, reaching as low as the $1450 level again.
Bonds
Bond markets in the United States have sold off quite drastically recently too. That, of course, is a very good sign for risk appetite as well. Bonds are considered to be the “de facto risk-free asset” for the world, as as long as the US treasury market continues to find sellers, that’s an excellent sign of potential “risk-on” trading.
- Gold markets testing significant support
- The precious metal has sold off drastically
- Federal Reserve tomorrow
Gold markets have sold off again during the trading session early on Tuesday, as traders question whether or not the “risk-off” position is the trade that should be taken.
With the Federal Reserve coming out with a statement tomorrow, it is possible that they will disappoint the market. That will probably crush gold, as a lot of people are starting to bake in the idea of major quantitative easing.
Technical analysis
Gold monthly chart
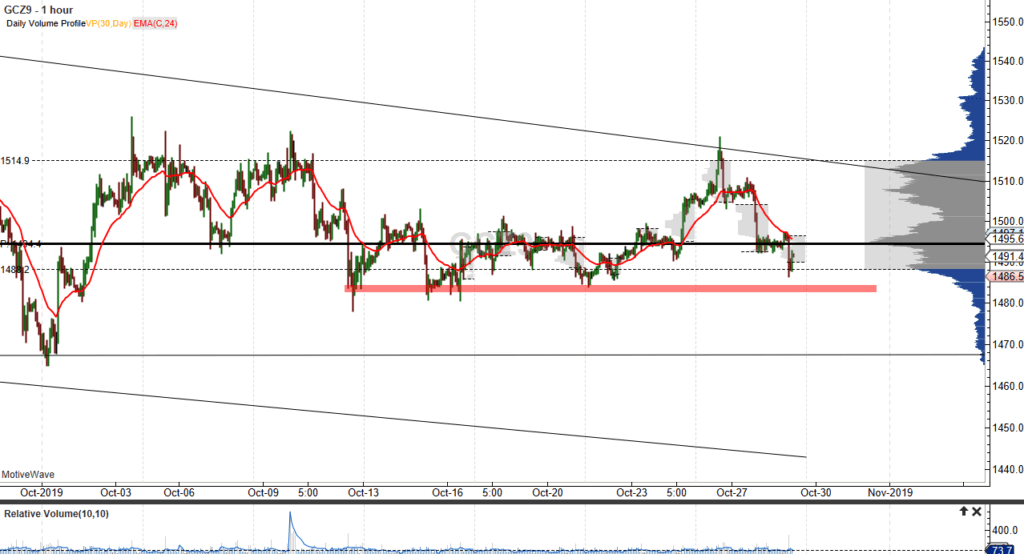
The technical analysis for the gold market is rather interesting at this point, considering that the market is sitting near the $1485 level – an area that has offered quite a bit of support in the past. Beyond that, it is at the bottom of the “value area” of the 30-day volume profile. In other words, we are close to the bottom of “normalcy” over the last month.
It’s very likely that the next 24 hours will be very quiet until the Federal Reserve makes its announcement at 2pm Eastern Standard Time on Wednesday. When that announcement comes out, traders will be paying attention to not only the interest-rate decision, but also the accompanying statement. If it sounds hawkish, that could be the one thing that breaks this market down below the support just underneath and unwinds gold down to the $1470 level.
The alternate scenario could be that the Federal Reserve sounds very dovish. The market would then break above the $1500 level, which could open the door to a move for another $10 or so to the upside. At this point, it is a bit of a 50-50 trade, meaning things could get very dangerous for those who simply jump in with both feet.
It should also be noted that on the daily chart there is a bit of a bullish flag, but it is running out of time. If we can break out to the upside, it could send this market looking towards the $1800 level. That would make a bit of sense considering there is so much in the way of technical analysis, geopolitical concern, and loosening of central bank policy around the world, whatever the Federal Reserve does.
The trade going forward
The trade going forward in this market is probably best done an hour after the decision is made. This is because the lack of liquidity could throw the gold market around like a ragdoll heading into that announcement.
However, if the market does break above the $1500 level between now and then, it’s very likely that you could go ahead and pick up that $10 worth of move. Traders will be trying to “front-run” the announcement, as they do occasionally. Otherwise, sitting on your hands until seeing what the reaction is for a good hour after the announcement is the prudent thing to do.


