- Gold markets in large flag
- Fibonacci ratios holding
- 50 day EMA moving at speed
Gold markets have been very active this year. They were gaining quite drastically until the last several weeks. Perhaps the pullback has been more or less a bit of digestion. The month of August alone was worth 15% in gains. That’s a huge move in any market, let alone Gold which is one of the larger contracts traders get involved with.
Trendlines
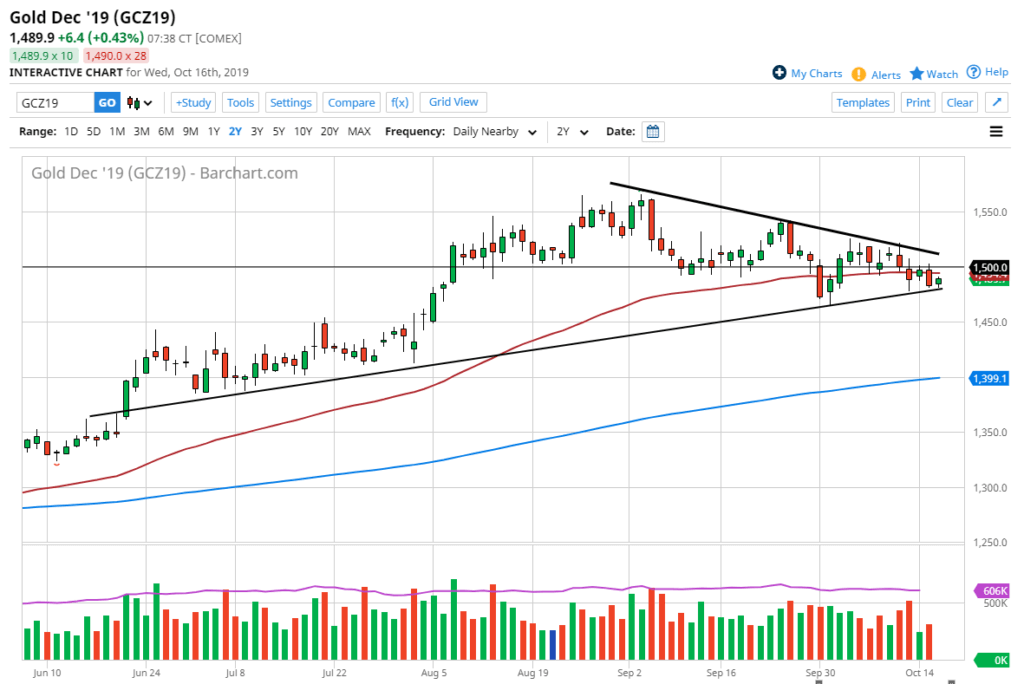
There are several trendlines worth paying attention to in the market. Not the least of which would be the two that make up the flag marked on the chart. Ultimately, the market will need to make a decision. While the flag is of the bullish variety, that doesn’t necessarily mean that it has to breakout. However, there are strong arguments to be made for breaking the top of it. This would be a very bullish sign, perhaps sending this market to $1650. After all, it would, in fact, be a clearance of a downtrend line. The measured move of the flag pole suggests that level as a target.
Other technical factors
There are other technical factors to take into account as well. The 50 day EMA is currently slicing through the last several candlesticks and flattening out. This is rather bullish when you think of the fact that the larger technical pattern is negative. As long as the 50 day EMA doesn’t slope lower, it does show the possibility that the market could break out. If that’s going to be the case, then the $18.75 level would be an area of interest as it was a recent high that tested that trend line. Ultimately, that would be the initial target on a breakout to the upside.
Another thing to pay attention to is that the market has accepted the 38.1% Fibonacci retracement level as support as seen by this triangle, so a break higher from here would tie-in quite nicely with Fibonacci trading in general. That being said, the exact opposite can be true as well, if that level gets broken it would signal much more bearish pressure in this market and have traders selling.
External factors
Keep in mind that the precious metals markets are often influenced by geopolitical concerns, and economic growth or weakness. There are a lot of things to worry about in general right now so the fact that precious metals could take off to the upside would not be a huge surprise.
The market has been in a long term trend to the upside for several different reasons, not the least of which would be central bank easing which shows no signs of slowing down. Just last night the Bank of Japan suggested that much more quantitative easing was coming out of that central bank, and the Federal Reserve, of course, is set to start cutting rates again in October. That being said, gold should have a relatively strong case for buying ahead. However, waiting for that downtrend line is going to be crucial. Otherwise, the market could break down rather drastically if the triangle kicks off, but so far it has avoided that.
- Major trend line holding market up
- Longer-term uptrend in sight
- Central banks continue to ease policy
Gold markets rallied a bit during the trading session on Wednesday, and we continue to see the uptrend line hold the market higher. It looks as if the gold markets will continue the overall uptrend, but the 50-day EMA just above could come into play. If that’s going to be the case, it’s likely that the next few days will be rather crucial.
Choppy turnaround?
Looking at the area that the market is in right now, it features not only an uptrend line, but also a couple of hammers in this general vicinity. With that being the case, it’s likely that buyers will be somewhat aggressive. There are also plenty of things out there to throw the market around.
At this juncture, the uptrend line will be crucial to pay attention to, and as long as the market is above that line, there is the possibility of holding an upward attitude.
Regardless, with the 50-day EMA just above and the wicks at the top of the previous handful of candles, the market should find some selling pressure. Ultimately, this is a market that will be news-driven more than anything else, as gold is considered to be a “safety market”.
Gold technical chart
The market going forward
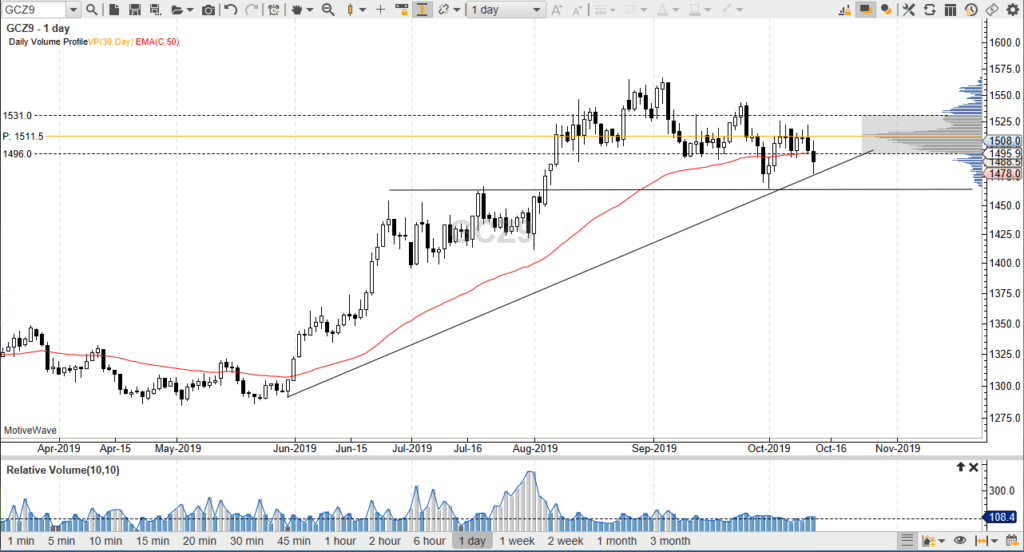
The most important thing to pay attention to here is the overall trend. One must also note that the most recent value area has been found near the $1510 level, which means there are plenty of traders interested in the market in that area, providing a bit of upward pressure as well. It should also be pointed out that there is a little bit of a “gap” in volume above, and that should allow gold to rally rather quickly.
If the market was to break down below the uptrend line, it could open up the gold market to the $1450 level. This area has seen resistance in the past and could offer support based on the mid-century mark and, of course, the fact that it should bring in “market memory”.
However, it should not be forgotten that there are central banks around the world that continue to ease monetary policy. Naturally, there is a significant amount of fear when it comes to Brexit, the US/China trade relations, tensions in Syria, and a whole host of problems that could have money looking to gold for safety.
Buying on dips should, in theory, continue to work out. This is because, although lately the market has pulled back significantly, that was probably necessary to continue the overall upward momentum in a market that has been very bullish for quite some time.
- Potential trend line building
- 50-day EMA in the neighborhood
- Found support at previous hammer
Gold markets have been all over the place during the trading session on Friday as the United States and China continue to talk about trade. This will have a major influence as to where the market will be moving, as it gives us more of a “risk-on/risk-off” type of scenario. That being said, there are still plenty of reasons to think that perhaps gold should continue to rise.
Fundamental reasons for gold strengthening
Gold markets have multiple reasons to rise. For one, the central banks around the world are cutting interest rates and adopting more of a dovish attitude regarding monetary policy. It looks as if loosening monetary policy is simply going to continue going forward, which should drive currencies lower. That being said, the first question that a lot of people may ask is about the US dollar and whether or not it can strengthen simultaneously. Simply put: yes, it can, and it has rallied right along with gold quite often in the past.
With the concerns about the trade talks going on, and of course geopolitical concerns in the Middle East, there are ample reasons to think gold would be sought after as a safe haven. Yes, it has rallied far too much until recently, and it appears likely that a lot of this pullback has simply been a bit of profit-taking. Certainly, the sell-off hasn’t exactly been brutal.
Technical analysis
Gold chart
Gold markets have formed a potential uptrend line and found quite a bit of support in the neighborhood they are trading in right now. Ultimately, this is a market that is finding buyers based on the breakdown. That’s because, although there were many tweets and headlines suggesting the world was coming together perfectly, it’s obvious that there are still a lot of cynics out there. Beyond all of that, the 50-day EMA is slicing right through the middle of the daily candlestick, which will attract a lot of attention in and of itself.
If we could get below the trend line, the $1460 level would offer support, but breaking down below there could open the door to the $1400. On the other hand, if the market was the gap above that point of control, then it would open up a move to much higher levels – perhaps even the highs that we saw recently.
- Gold finds support at 50-day EMA
- Dueling trend lines
- Crucial $1500 level in focus
Gold markets rose slightly during the trading session on Tuesday, as we continued to get more Brexit noise coming out of the Twitterverse, with sources claiming that Angela Merkel told Boris Johnson the European Union would not accept the deal that doesn’t keep Northern Ireland in the customs union. This essentially puts the no-deal Brexit option back on the table, and that should not come as a surprise. However, markets certainly reacted, perhaps due to algorithmic trading more than anything else.
Larger triangle
Gold chart
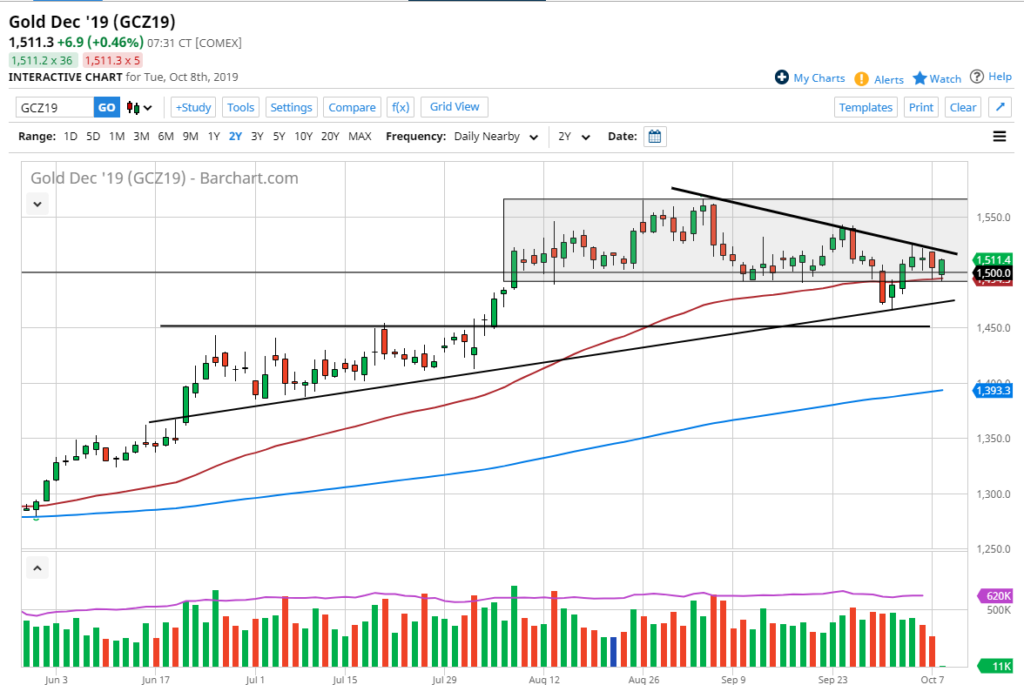
Over the last several months, the market has seen both an uptrend line and a downtrend line forming a massive triangle. Looking at the chart, an argument could be made for either direction to trade. Longer-term, however, it does tend to favor the upside as there are a lot of geopolitical and trade issues that continue to cause a lot of volatility. Volatility in the precious metals markets tends to favor the upside because it’s a form of uncertainty, which typically has people buying quicker than selling.
The previous trend was to the upside, so it makes sense that we could get a bit of consolidation followed by continuation, as is typically the case. However, it’s not until the market breaks above the descending triangle, which is closer to the $1520 level, that buyers will have firmly taken control.
Levels to watch
There are a multitude of levels to pay attention to currently in the gold market. These include the $1500 level, which has a certain amount of psychological weight to it. Beyond that, the $1490 level is the bottom of support from this zone. Recently we broke down a bit, but we have found more support at the uptrend line closer to the $1475 level. Again, a break above the $1520 level would crack the top of this triangle, sending the market looking towards the $1540 level, followed by the $1560 level.
Trading gold going forward
Looking at the chart, it’s easy for traders to simply buy the dips, as the market has been so resilient over the longer-term. The reality is there are so many moving pieces that could throw risk appetite all over the place, and that could drive the market. The gold markets are primed to go higher based on the US/China trade disappointments, the Brexit mess, global slowdown concerns, and central banks around the world cutting rates. There are plenty of fundamental reasons to believe the gold markets will continue to be favored, with the lone exception being the fact that the US dollar has been strengthening simultaneously.
- Bullish weekly candlestick
- Bounced from major trendline
- $1500 holds steady
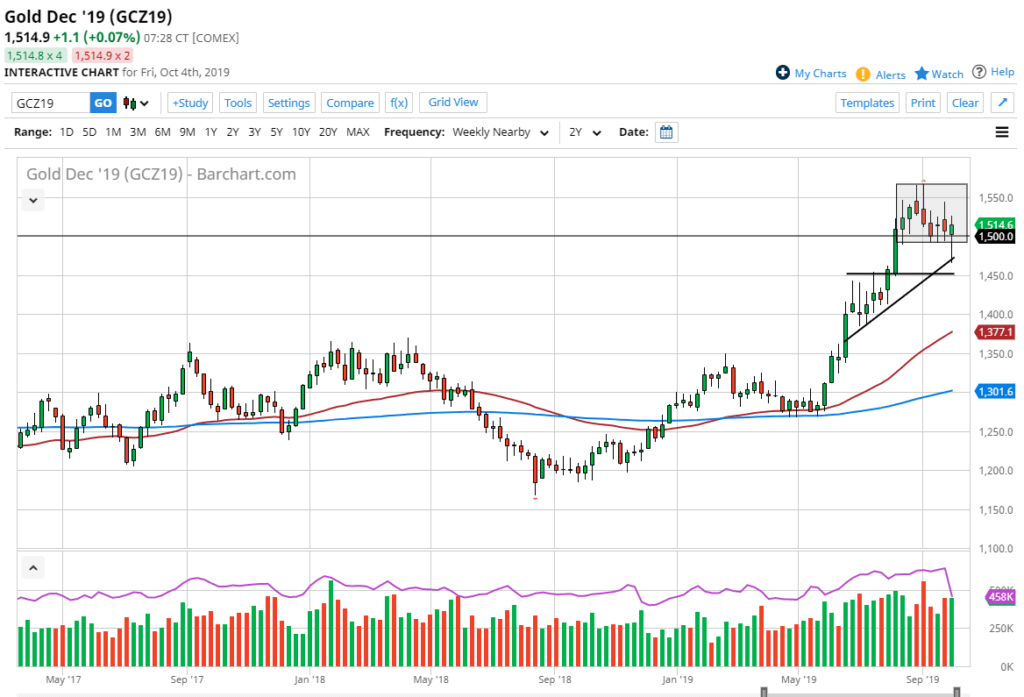
The gold market has been all over the place over the previous week, but it has shown signs of strength as the market continues to recover every time it pulls back. The candlestick is a hammer which of course is a bullish formation, and the fact it has bounced from a major trendline does not hurt the bullish case either.
Gold has been increasing its strength due to central banks loosening monetary policy while cutting interest rates as well. Both of these are good for gold longer-term, so the fundamental and technical pictures for this market tend to agree. Ultimately, the trend looks likely to stay the same.
Multitude of reasons for uptrend
Gold weekly chart
Not only are there a lot of concerns when it comes to fiat currencies and monetary policy through central banks around the world, but there are a lot of geopolitical issues out there that could come into play when it comes to making a decision to buy gold. With the US/China trade situation not looking likely to go anywhere anytime soon, there are a lot of worries concerning the idea of geopolitical issues. These include Brexit, tensions in Hong Kong, and the Islamic Republic of Iran. All of these are reasons to think that gold should continue to at least attract some attention from gold buyers in the market.
Technical support
Looking at the weekly chart, it’s easy to see that the $1500 level would attract a lot of attention. Beyond that, there is also the trend line that marked the bottom of the week. A “perfect candle” here is worth paying attention to, as it shows there is quite a bit of resiliency in this market. Over the last several months, the market has been grinding from the $1300 area, and it should expect more of the same as the situation has not changed. Granted, the US economy seems to be holding together quite nicely, but the rest of the world is most certainly struggling. Although gold is typically measured in US dollars, there could be better value to be found buying gold and other currencies that have been struggling, most specifically the euro or the pound.
Either way, the market still looks very healthy and should go looking towards the highs that were made near the $1560 level. At this point, gold looks to be extraordinarily bullish, and it should continue to find plenty of buyers every time it dips on shorter-term charts. Gold will more than likely reach towards the $1800 level over the next several months.
- Trend line looking to hold
- Major support level below
- Buying started in Asia
Gold markets fell initially during trading on Tuesday, but they have turned around to break back above the trend line as the American session opened. At this point, the market looks as if it is trying to form a hammer, but there is still a significant amount of noise above that is going to cause some issues.
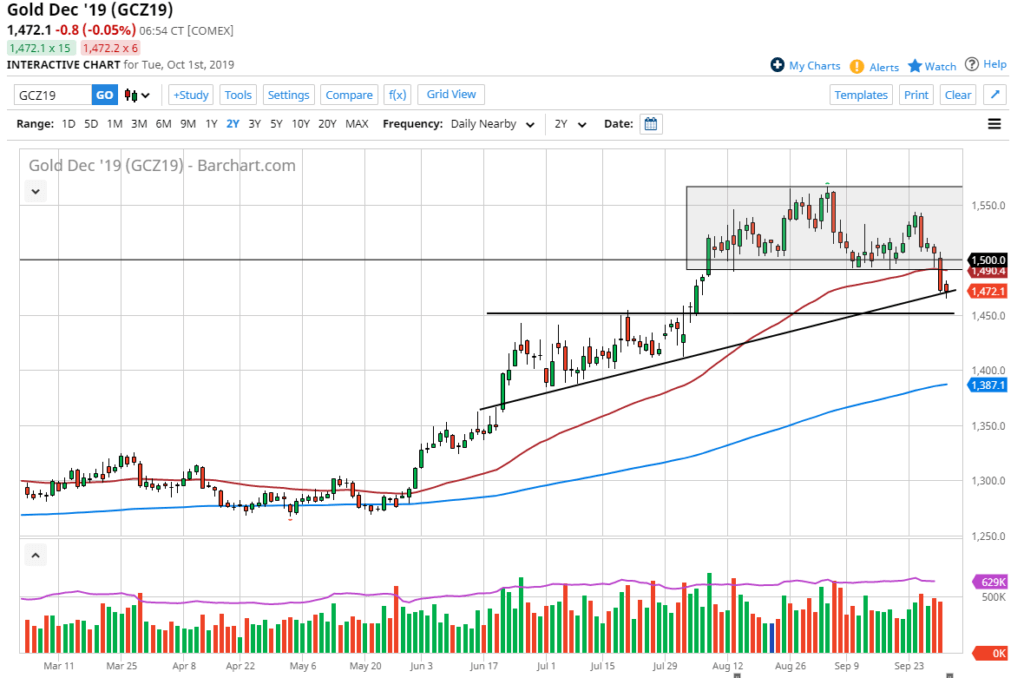
All of that being said, the market has been in an uptrend for some time. It’s likely that we are going to see buyers step in and try to push this market towards the 50-day EMA again, which is currently sitting at the $1490 level. That provided massive support, and the fact that it was broken is a negative turn of events, but not enough to change the overall trend. At this point, it’s very likely that gold will find buyers sooner rather than later.
Major support underneath
Gold chart
Looking at the gold market, it’s easy to see that there is major support at the $1450 level, due to the fact that it was the top of the ascending triangle laid out on the chart. Ultimately, there should be a lot of buying pressure in that area as well, and that’s assuming that we can even get down there. Trying to buy gold in small increments makes sense, as it will perhaps allow traders to bid for a larger core position.
Global fear moving markets
Gold markets will eventually get a boost due to the central banks looking to ease monetary policy, or global fears in general. After all, we have seen several central banks cut interest rates or start one form of quantitative easing or another.
Levels to watch
There are several levels to watch above, the first of which is the $1490 level, followed by the psychologically important $1500 level. A move above there opens up the door to the $1525 level and finally the $1540 level. Those are all the immediate levels that the market will be aiming for, with the longer-term outlook of possibly reaching as high as $1600 after that.
This doesn’t mean that the move higher will be easy, but it certainly could be helped by the occasional headline that seems to be an almost weekly event now. One thing is for sure: recently, we have seen more risk to the upside for safety assets than down. In the big picture, not much has changed that would put bearish pressure on gold, at least for a significant move.
- Gold markets continue to hang onto $1500
- The precious metal supported by loose monetary policy globally
- 50-day EMA just below
- Ascending triangle also supportive below
Gold markets did very little during the trading session on Friday, but it should also be noted that it was “quadruple witching Friday”, meaning four different variations of options were expiring. This means that people were buying and selling to hedge large positions, so these few days generally tend to be quite choppy. Beyond that, the gold markets are hanging around a crucial level.
The importance of $1500
Gold daily chart
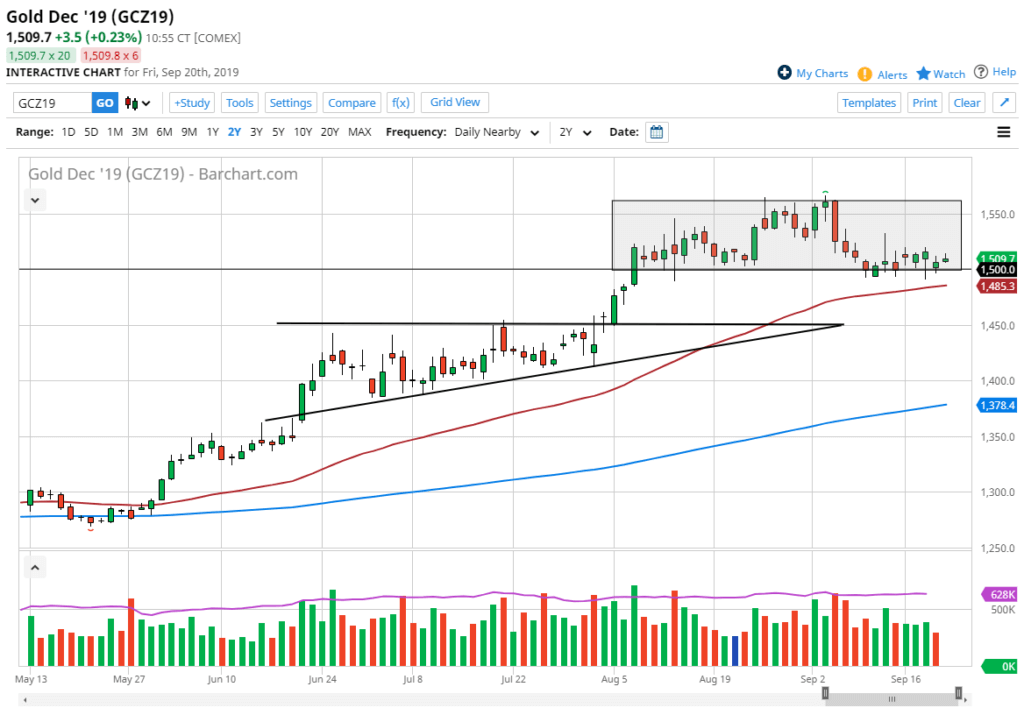
The importance of $1500 cannot be overstated. This is an area that has been rather supportive, extending down to the $1490 level as it is more or less a “support zone”. There is also the 50-day EMA underneath, rallying and tilting to the upside. The 50-day EMA is a very crucial technical analysis indicator for longer-term traders as well, and therefore this study will probably bring a certain amount of buying pressure by itself.
Beyond that, the $1500 level is the bottom of the overall consolidation area that we have been in since the initial push higher. We have simply been digesting very strong gains, and the fact that we have not pulled back significantly suggests we are going to continue to see buyers, given enough time. As soon as people are comfortable with these levels, the market will go much higher. Simply put, the longer the market sits at this level, the more likely participants will start to feel very comfortable with this price, meaning they will step into the market and start buying again.
Ascending triangle
The ascending triangle below had resistance at the $1450 level, which is also going to be very supportive. It’s not until the market breaks down at that level that sellers will start to be concerned about a significant pullback. All things being equal, the market has been bullish due to central bank liquidity measures.
The play going forward
The play going forward is to simply find value in the gold market and start to buy it again. Shorting gold is almost impossible, because the biggest players in the world, central banks, are starting to buy as well. Beyond that, there are a lot of geopolitical concerns out there that could cause major problems. Those particular concerns have caused money to flow into gold for safety. Furthermore, there are many concerns about the so-called “trade war” between the United States and China, which has people looking to gold as a way to preserve wealth.
Short-term pullbacks should continue to offer a nice buying opportunity, and the targets could be $1600, $1800, and then finally $2000. It isn’t that we will get there right away, but those are the most common targets on longer-term charts that will certainly be tested.
- Drone attack sends traders looking for safety
- Market testing resistance
- 20-day EMA in focus
Gold markets gapped higher during the open on Monday as the world finally had a chance to react to the drone attacks in Saudi Arabia. Gold was being used for a safety trade, as this could lead to significant market corrections around the world. Because of the gap, one would expect upward pressure, but it had already turned around to fill some of that gap. It should be noted that after the Asian session, the gold markets seemed to calm down a bit.
Technical analysis
Gold September 19 daily chart
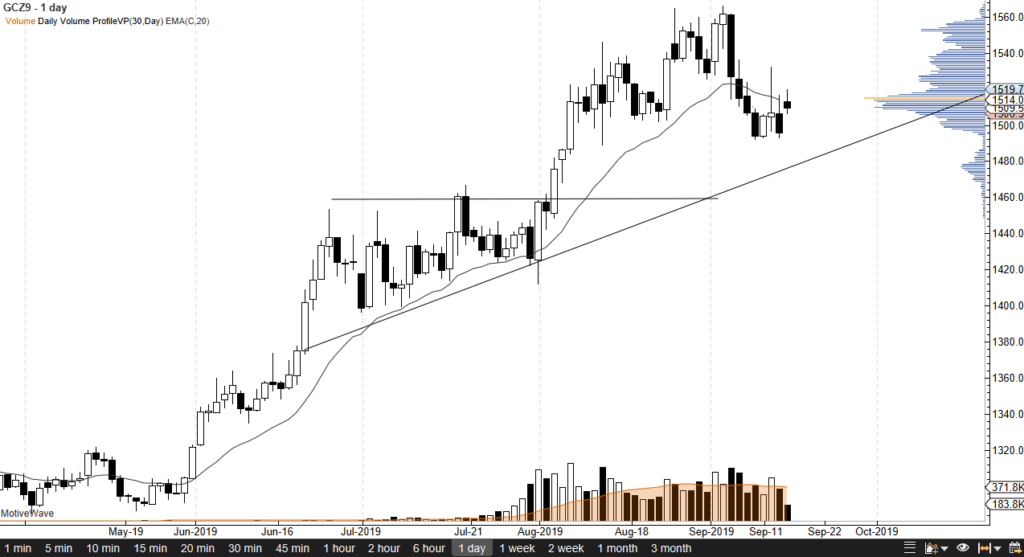
The gap is very bullish-looking, but in typical fashion, the gap will eventually get filled. This means that gold could pull back a bit in the process to reach the $1495 level. If that level gets broken to the downside, it will be a very negative sign. A gap that gets filled and then broken through is one of the more negative technical signals out there.
The 20-day EMA is slicing right through the candlestick as well. This is worth paying attention to, as it has been relatively reliable as dynamic support and resistance. In other words, there is a certain amount of resistance just above, and it should be pointed out that the yellow bar on the volume profile for the last 30 days suggests we are just below the highest volume of the last month. In other words, it may be difficult to go higher from here. Also, the fact that the markets have calmed down suggests that perhaps there was a measure of overreaction at the open.
All that being said, there is a nice trend line underneath that should offer some support anyway. That means you may be able to pick up gold on the cheap in the next few days. It should also be pointed out that silver rallied well over 2%, while gold only did 1%. In other words, silver seems like it still wants to outperform when it comes to the metal sector.
The trade going forward
The trade going forward is to simply wait for the gap to be filled and take advantage of any bounce that shows up. Ultimately, if we were to break above the highs of the trading session on Monday, that would also be a buying opportunity. If none of those scenarios show, then we start to look at the trend line a little closer to the $1480 region. There is no reason to be short of gold at this point, but realistically speaking, we have been overbought for some time. Looking at the chart, there should be plenty of opportunities to go long over the next couple of weeks. If the trend line were to be broken, then the market would more than likely go looking towards the $1450 level underneath.
- Gold markets rallied rather significantly during the ECB announcement
- $1500 offer support
- Technical analysis all points to the upside
Gold markets exploded to the upside during the trading session on Thursday as the ECB announced that they were cutting interest rates to -0.5%, and continuing to expand quantitative easing, in a program that is buying unlimited bonds for as long as it takes to turn things around. In other words, the ECB has completely capitulated to the lack of growth, and now it makes sense that quite a bit of bullish pressure in the precious metals should continue to be seen.
Technical and fundamental analysis
Gold Daily Chart
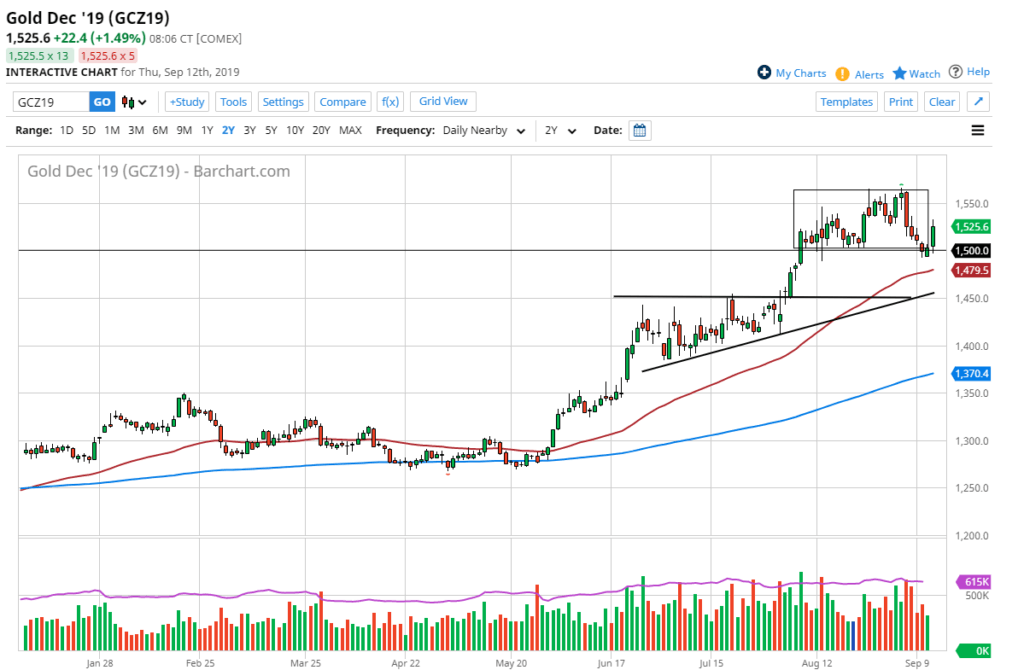
The technical analysis for this market is very strong all the way around. At this point, the $1500 level looks massively supportive, as it is a large, round, psychologically significant figure, and will attract a lot of attention. Beyond that, the 50 day EMA is just underneath, and that of course offers a significant amount of support as well. We had previously been in a consolidation area between the $1500 level and the $1600 level. Overall, this is a market that has seen a lot of action in this area, and now that fundamentals are starting to pick up for the gold market as well, it’s likely that we will continue to see buyers on dips.
Beyond that, the uptrend line hasn’t even been tested yet so if we do fall from here it’s very likely that we could go higher. Longer-term, the market breaking above the $1600 level could send this market towards the $2000 level. Gold has just been confirmed in the uptrend by the ECB, and now that the ECB has gone all in when it comes to quantitative easing, it is almost forcing the Federal Reserve to do something drastic as well. In other words, we are still very much in that scenario where the central banks will do everything they can to re-inflate the economy, driving down the value of fiat currencies in general.
The trade going forward
The trade going forward of course is to buy gold on dips and therefore it’s likely that we should continue to go much higher. All things being equal, the 50 day EMA should be massive support but quite frankly it would be very difficult to get down through that level as the explosive nature of the trading session on Thursday certainly has helped solidify what the markets have already shown. To the upside, there will be various resistance barriers in the form of the $1600 level, $1700 level, and so on all the way up to the $2000 level. This doesn’t mean that we won’t get a significant pullback occasionally, but overall selling gold is all but impossible at this point. We are in a longer-term cyclical bull market.
- Gold markets break down through $1500 level
- Still in an uptrend
- Looking for value
Gold markets broke down during the trading session on Tuesday, slicing through the $1500 level. This is a very psychologically important figure, but at the end of the day, it’s not the be-all-and-end-all of support. The fact that we have sliced through that area will attract a lot of headlines in news outlets, which could cause concern among retail traders.
Futures markets volatile
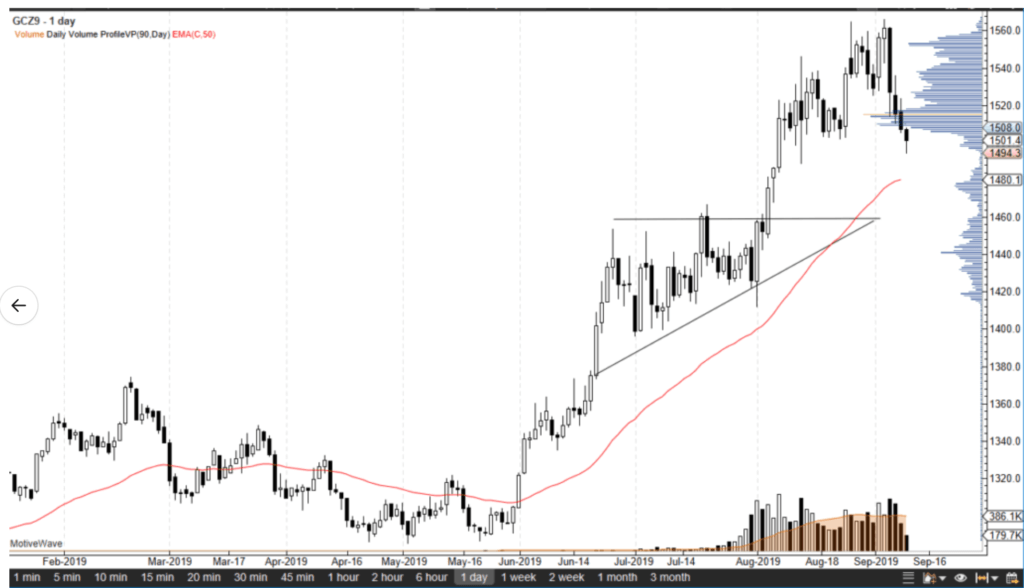
Gold daily chart
The gold December 2019 contract has been relatively negative over the last couple of days, but the fact that we have stalled a bit just below the $1500 level suggests we are in fact still in an uptrend, although we have seen quite a bit of downward pressure. Ultimately, this market is still much higher than it was six months ago, and it should be recognized that gold tends to be more of a safety trade, so therefore traders will hang onto their positions much longer.
Technical analysis
The technical analysis for this market is still very strong, although we have broken through the big figure. The 50-day EMA, painted in red on the chart just below at the $1475-ish level, should offer some support. That is the beginning of massive support, which extends down to the top of the previous ascending triangle that kicked off the latest leg higher. It would not be surprising at all to see this market end up down there, because that is a resistance barrier that has not been retested. Regardless, there’s a theme here: there are plenty of buyers underneath, and obviously, there will be plenty of traders looking to pick up a bit of value.
The ascending triangle underneath shows signs of potential support as well, so ultimately this is a market that is simply looking for buyers. Beyond that, you can see that the 90-day volume on the right-hand side of the chart was very thin on the way out, and we are starting to see a break down through thinner volume. The thinner volume will be tested, at which point it’s likely that the market will try to consolidate at one of the support levels underneath, build up volume in that area, and then continue the uptrend.
Safety trade
Keep in mind that the safety trade is very much in effect. As we get negative news coming out of the US/China situation, Brexit, global growth, and possibly the ECB meeting later this week, we could get traders coming back into this marketplace. Looking for volume to pick up underneath and a bounce will be crucial for the longer-term directionality of this market. As far as selling gold is concerned, it’s very difficult to do so due to the fact that the global marketplace is essentially on pins and needles. At any moment, we could see a complete turnaround and the market racing to the upside.


