- 50 day EMA reaching towards price
- $0.20 likely to be important
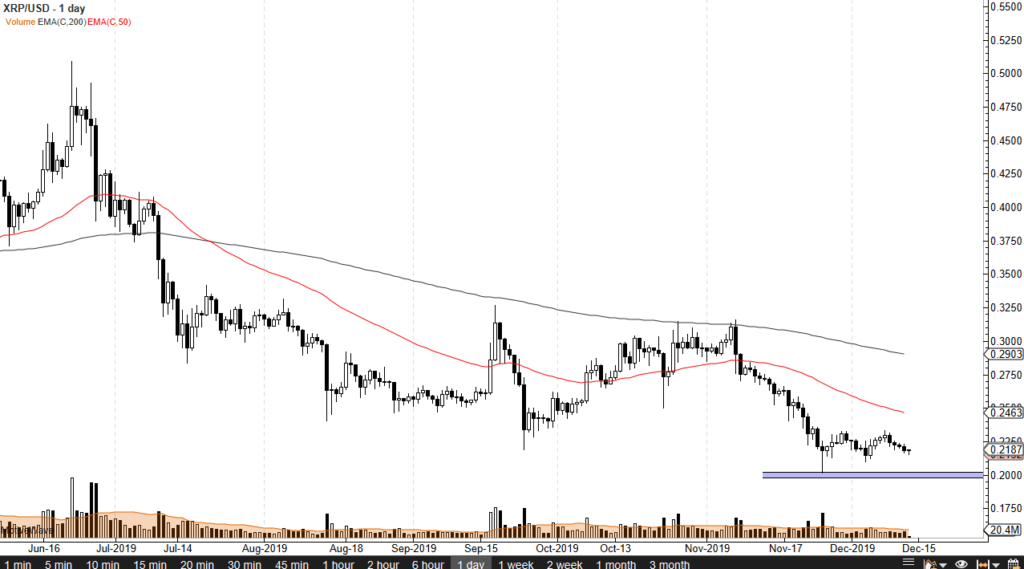
During a relatively quiet trading session on Friday, the market looks as if it is trying to form some type of basing pattern, sitting just above the $0.20 level. Ripple continues to struggle in general, as the cryptocurrency markets have been pummeled during most of the year. However, Ripple has made a bit of a stand-in in this general vicinity.
Ripple technical analysis
The technical analysis for this pair is rather bleak, all things considered. The 50 day EMA is just below the $0.25 level, a significant area from the aspect of psychology. The 200 day EMA is sitting just below the $0.30 level, which also has a certain amount of psychological significance to it. The moving averages are spread out quite nicely, and both tilting lower, a very negative sign indeed.
That being said, $0.20 is psychologically important as well, as it is also a large, round, whole number. There has also been a massive hammer forming on high-volume in this area last month, so it will be interesting to see whether or not this holds. So far, it has already formed a “double bottom.” If it can hold here, this would then be a “triple bottom”, which would be very bullish. If prices were to break down below the $0.20 level, it would be extraordinarily negative, and probably open up Ripple for another $0.05 lower pricing.

XRP/USD chart
Bitcoin
Unfortunately for Ripple, most volume in cryptocurrency these days is done through Bitcoin. In other words, market participants will need to see Bitcoin take off to the upside in order for other cryptos to have a fighting chance to change the overall trend. At this point, Bitcoin is crucial as it is the “grandfather” of most cryptos. With that in mind, the Bitcoin chart can be used as a secondary indicator.
Going forward
Going forward, it’s very likely that the market will continue to chop around this area. There has already been some churning in this area, and the question now is whether or not things can hold. Because of this, a break below the $0.20 level is an obvious bearish signal, but if the market can turn around and overtake the 50 day EMA, it would be a sign that perhaps things are going higher.
A break above the 50 day EMA would bring in fresh short covering, and people looking for value. Adoption of Ripple has been a bit slow, but the adoption of cryptocurrency, in general, has been slow. The $0.20 level has been important more than once in the past, and it certainly looks as if it’s likely to be so yet again.
- Ripple has been in a freefall this month
- Bitcoin not helping the situation
- Holding above major technical level
Ripple has gotten hammered over the last month, dropping down towards the $0.20 level. This is a large, round, psychologically significant figure that should continue to be paid attention to.
This level has caused noise more than once when it comes to Ripple, and therefore it’s likely there will continue to be a lot of buying pressure in that area.
No help from crypto markets
There has been no help from the cryptocurrency markets in general as they continue to experience a lot of volatility. The market certainly requires support from Bitcoin since it tends to drive the direction of crypto in general.
That being the case, it’s likely that the likes of Ripple will continue to struggle as Bitcoin drives most of the volume. It’s the correlated markets that continue to drive crypto in its general direction.
There seems to be a lack of desire to own crypto. At this point, Ripple will suffer at the hands of Bitcoin selling. Ultimately, this is a market that needs a bit of good news in general. What with the Chinese threatening to crack down on a lot of cryptocurrency, and the fact that Ripple simply isn’t being adopted as widely as once thought, there’s no reason to think that rallies are to be trusted at this point.
Technical analysis

Ripple/USD chart
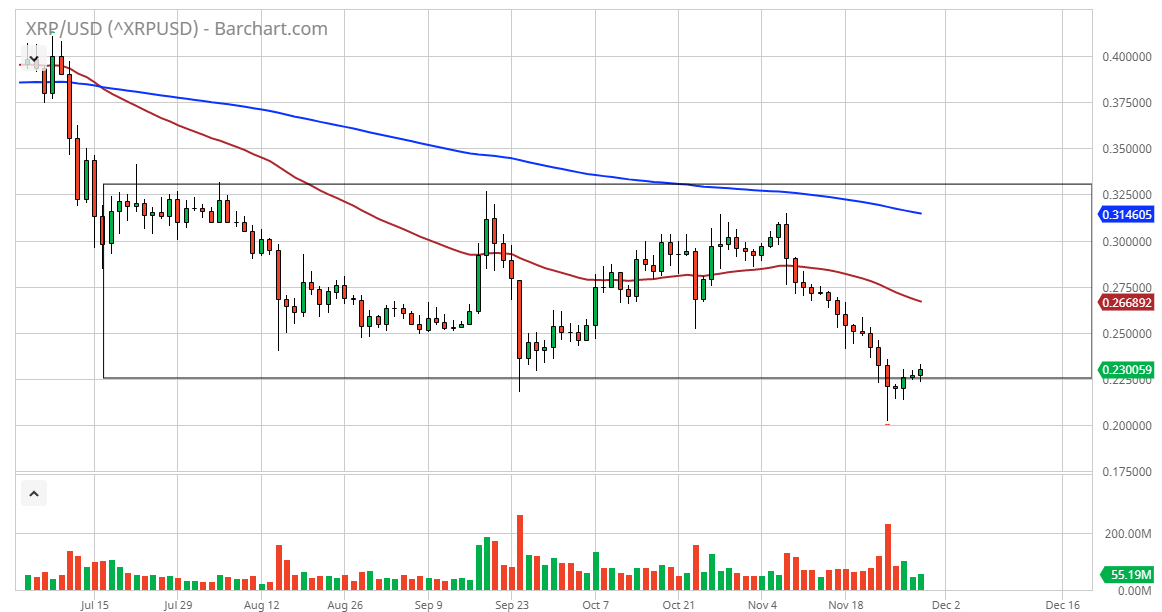
The technical analysis for this pair is rather dour. The hammer that formed on Monday bounced from the $0.20 level. That said, it’s still rather weak, with a string of 20 negative candles forming before the last couple of positive ones. This tells us that Ripple is still not to be trusted. It’s also likely that the 50-day EMA, currently trading at $0.266, will continue to cause a significant amount of resistance.
Markets can’t go down forever, so this bounce should be thought of as a short-covering rally, and an opportunity to take advantage of what has been a very strong downtrend. Otherwise, if one were to break to the upside, the market could reach towards the $0.325 level, which is the top of the overall consolidation area that the market had been trading in.
At this point, if we were to break down below the $0.20 level, it’s hard to tell where we would end up because it would be like a trapdoor opening. With this, it’s difficult to make an argument for buying, although it does at least “look cheap”.
- Ripple forming large rectangle
- 200-day EMA just above
- 50-day EMA just below
Ripple initially tried to rally during the trading session on Wednesday, before breaking down below the $0.30 level again. That being said, the market looks as if it is trying to confirm a potential rectangle. That could be a short-term pullback in the cards, going forward, for the Ripple market.
Technical analysis
The XRP/USD pair has initially shown strength over the last three sessions, but above the $0.30 level there is a significant amount of resistance. That resistance extends all the way to the $0.33 level. That is the top of the potential rectangle, and it isn’t exactly uncommon for there to be a “zone of resistance” at the top of one of these rectangles.
The 200-day EMA now sits just below the $0.33 level as well, so it makes sense that the market is going to struggle to get above here and break out. Having said that, if it did, it would be an extraordinarily bullish side.
The 50-day EMA sits just below, so we could get more of a grind sideways initially before a potential pullback. By breaking below the 50-day EMA, it’s likely that the market could go down to the $0.25 level underneath, which is the beginning of massive support that extends down to the $0.22 level after that.
All things being equal, the market does look as if it is trying to carve out a more stable consolidation area. Therefore, more back-and-forth trading is probably what you can expect in the short term.
Beyond the technical analysis on the chart, one should pay attention to the Bitcoin market, being a proxy for the overall attitude of the cryptocurrency markets. Most of the smaller coins will struggle if Bitcoin cannot show strength, so it’s important to ascertain how this cryptocurrency is trading before placing the trade in one of these markets.
The trade going forward
Looking at the chart, the trade going forward is to employ some type of range-bound system.
That being said, if the market does close above the $0.33 level, it’s very likely that it will continue to go higher, perhaps reaching as high as $0.40 going forward. To the downside, if the market was to break down below the $0.22 level, the $0.20 level would be targeted next due to the large, round, psychological significance of that figure.
Until something changes drastically, though, this could be a perfect trading vessel for short-term traders. The market continues to see a lot of choppiness, and if you can sit with your trade, you can do quite well in these types of situations. That being said, for the longer-term trade, the upside makes more sense.
- Broken trend line to the downside
- 200 EMA just above
- Crypto slumping in general
The Ripple markets have been sideways for quite some time, as cryptocurrency markets have struggled to gain a footing. With that, market participants have shown a proclivity to simply go sideways and do nothing. Meanwhile, central banks around the world doing everything they can to boost them by cutting interest rates, adding quantitative easing, and many other schemes.
Ripple, of course, is a relatively small coin and therefore secondary to places in markets like Bitcoin. Bitcoin has struggled quite a bit recently and has broken through a descending triangle, which of course is a very ominous sign for other cryptocurrencies such as Ripple, Ethereum, Litecoin, and many others. Quite frankly, if Bitcoin cannot take off to the upside, none of these other markets have any significant chance.
Trend line break
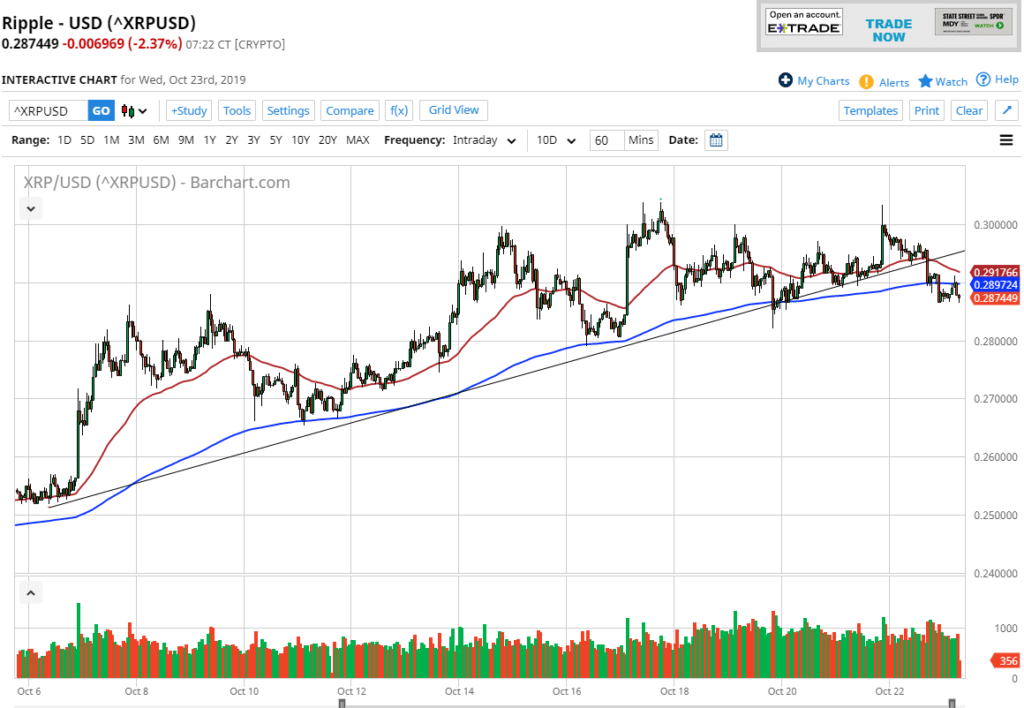
The trendline that has recently been broken had been very supportive for some time, but then got broken. The 200 EMA has been broken through to the downside, showing signs of rolling over and breaking down from there as well. With that being the case, it’s likely that the $0.28 level could be targeted, perhaps even lower than that.
Technical analysis
The technical analysis for this pair is, of course, that the trend is starting to change. Now, it is only a matter of time before a breakdown kicks off a shorting opportunity. At this point, cryptocurrencies look like they are sliding. Most profit will be made shorting these markets.
Below the $0.28 level, the next support level is at the $0.27 level, and then eventually the $0.25 level. To the upside, there is the 50-day EMA, which is crossing the $0.29 level, and the previous trendline, both causing significant resistance. With that in mind, it’s very likely that rallies will be sold into as well.

Ripple technical analysis
Fundamentally broken
It’s only a matter of time before the crypto markets will need to be whittled down to a few viable coins. Ripple may be viable due to the fact that it allows for transactions internationally through large banks, but the question is whether or not those banks choose to use it for their own coins, something that Ripple has to deal with.
Recently, it was seen to be the case. It’s likely that the market will stay viable over the longer term, but clearly it can’t hold significant value. The oversupply of coins for the market currently will continue to put downward pressure, especially if the “King” of crypto, Bitcoin, cannot get much of a bid these days. At this point, the crypto markets are starting to reflect real value and less speculative pressure.


