

Guide to Multiple Timeframes Analysis
The concept of a top-down analysis involves making a technical analysis based mostly on a trading theory or a set of indicators from the longer timeframes all the way down to the shorter ones. In doing that, traders are looking to catch both the longer and the short-term trades when trading the Forex market. The previous article here on the Forex Trading Academy dealt with hedging techniques and how they can influence a trader’s money management system. Because hedging is restricted in some parts of the world, we explained how this drawback can be avoided, and what to do to benefit from these types of hedging. The current article is intended to offer practical examples of how a top-down analysis can be used in a hedged account. It means that hedging should be allowed on that account. If not, using two different trading accounts, or simply trading overseas, may do the trick, and the results should be the same, as the overall idea is the same.
| Broker | Bonus | More |
|---|
Setting Up a Top-Down Analysis
As mentioned above, the starting point should be the longest timeframe possible, and then the analysis should continue on the shorter ones. For our practical example, we’re going to use the MetaTrader platform with the following timeframes: monthly, weekly, daily, 4-hourly and hourly. The next step is to have a trading strategy that should be applied/used on all these timeframes, starting with the longest one and ending with the shortest, or the hourly chart. For the sake of simplicity, we’ll use the RSI (Relative Strength Index) indicator, and we’ll look for bullish or bearish divergences between price and the oscillator. A bullish divergence calls for a long trade to be taken until the RSI reaches overbought/almost overbought levels, while a bearish divergence suggests that a short trade should be taken until the RSI oscillator comes down around the 30 level. As always in our RSI interpretation, the standard 14 periods should be considered. This means that for the RSI to plot a value, the oscillator will consider the previous 14 candles. If anything, traders should always stay with the oscillator as, between oscillator and price, the tendency is that the price is going to give the fake move.
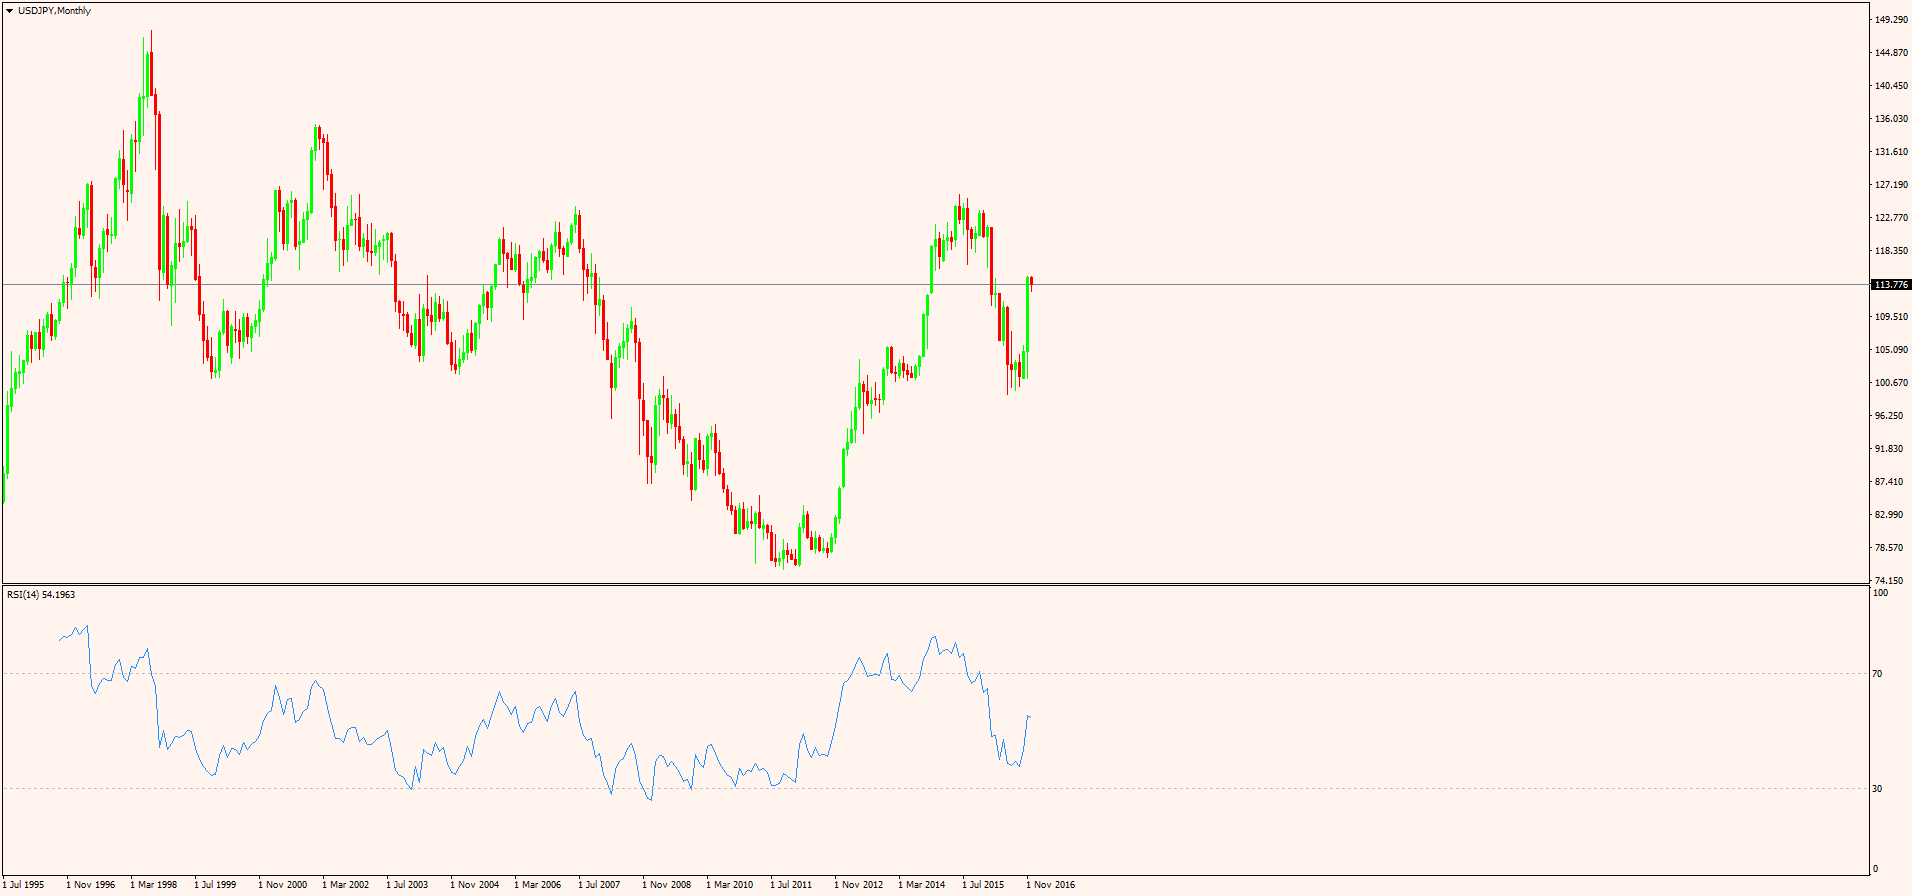
As you can see from the chart above, there is no signal that can be taken from this timeframe, as the price and the oscillator are showing the same thing; no divergence whatsoever forms here. Moving on to the weekly chart, we can see that a bearish divergence just reached the take profit in the period prior to the recent bounce we’ve seen. While the trade is not active anymore, it showed a solid set-up, netting more than 1,000 pips by the time the RSI reached values closed to the 30 level.
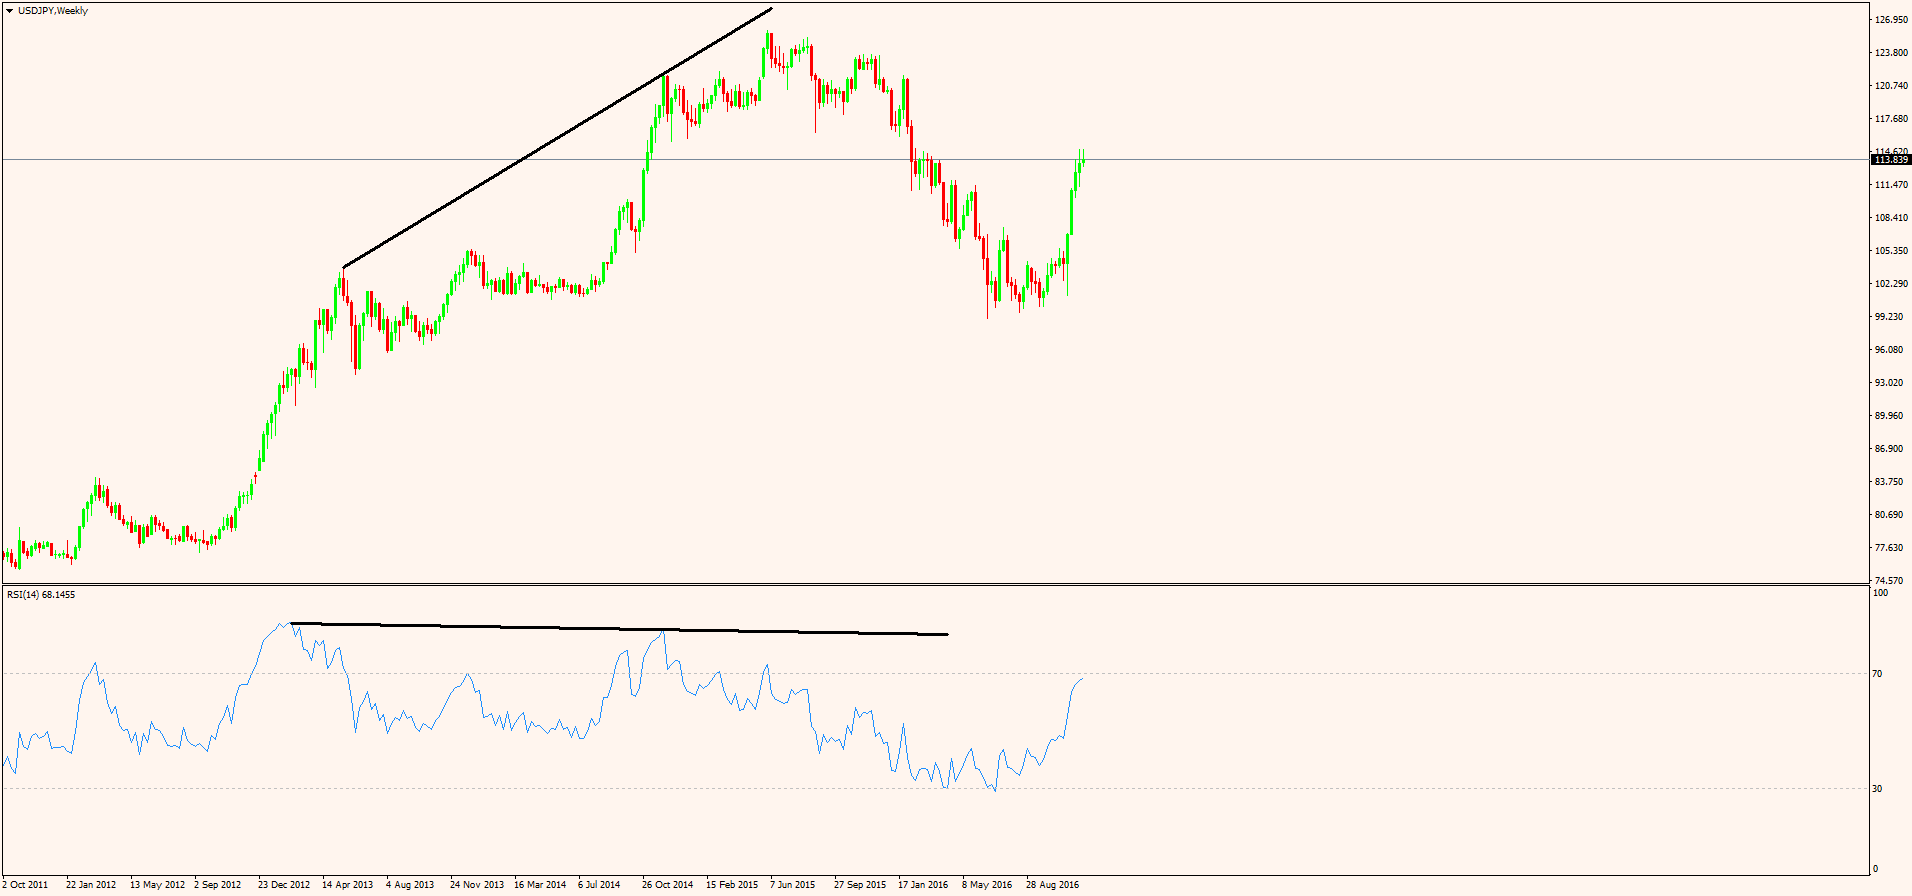
Still no active trades so far, but one should imagine that all the time while the USD/JPY short trade was active, other trades may have been possible to trade on the shorter timeframes, both on the short and long side. This is the whole purpose of doing a top-down analysis in the first place.
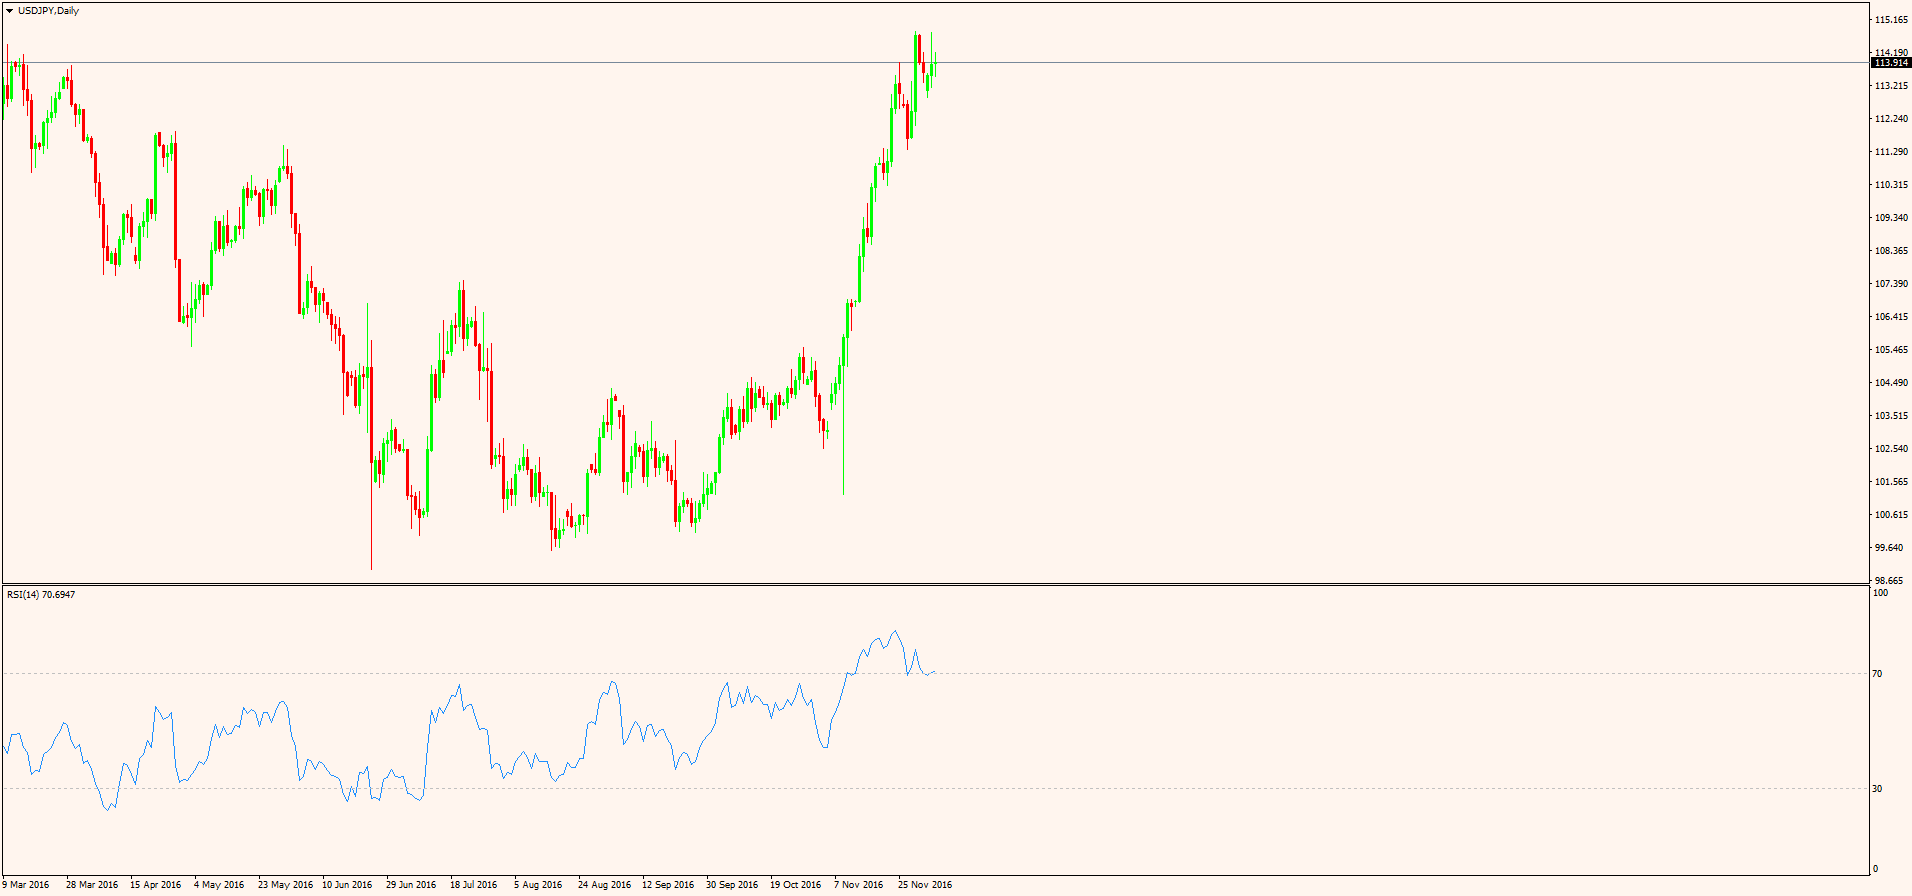
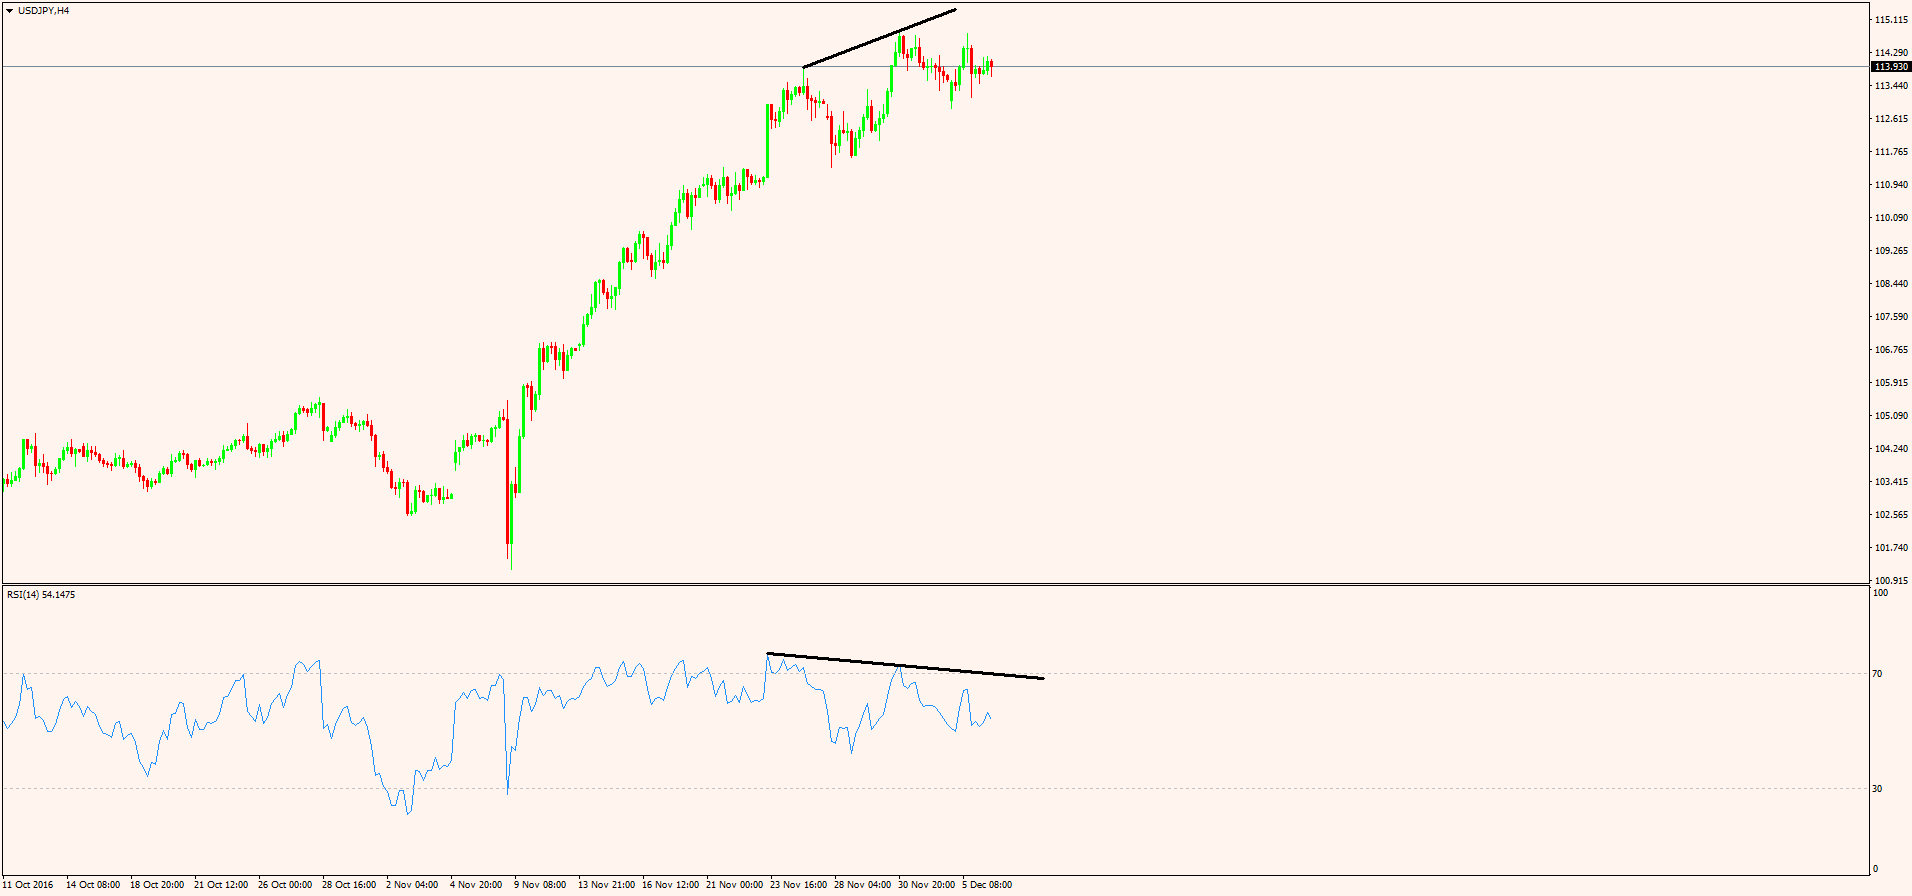
The daily chart shown above is not showing any meaningful divergence that should be traded at this very moment, so it is a timeframe that just needs to be watched for a new signal to appear. However, the 4-hour timeframe below shows a bearish divergence forming, and the trade is still active, in the sense that the RSI still has room to travel until the 30 area is reached.
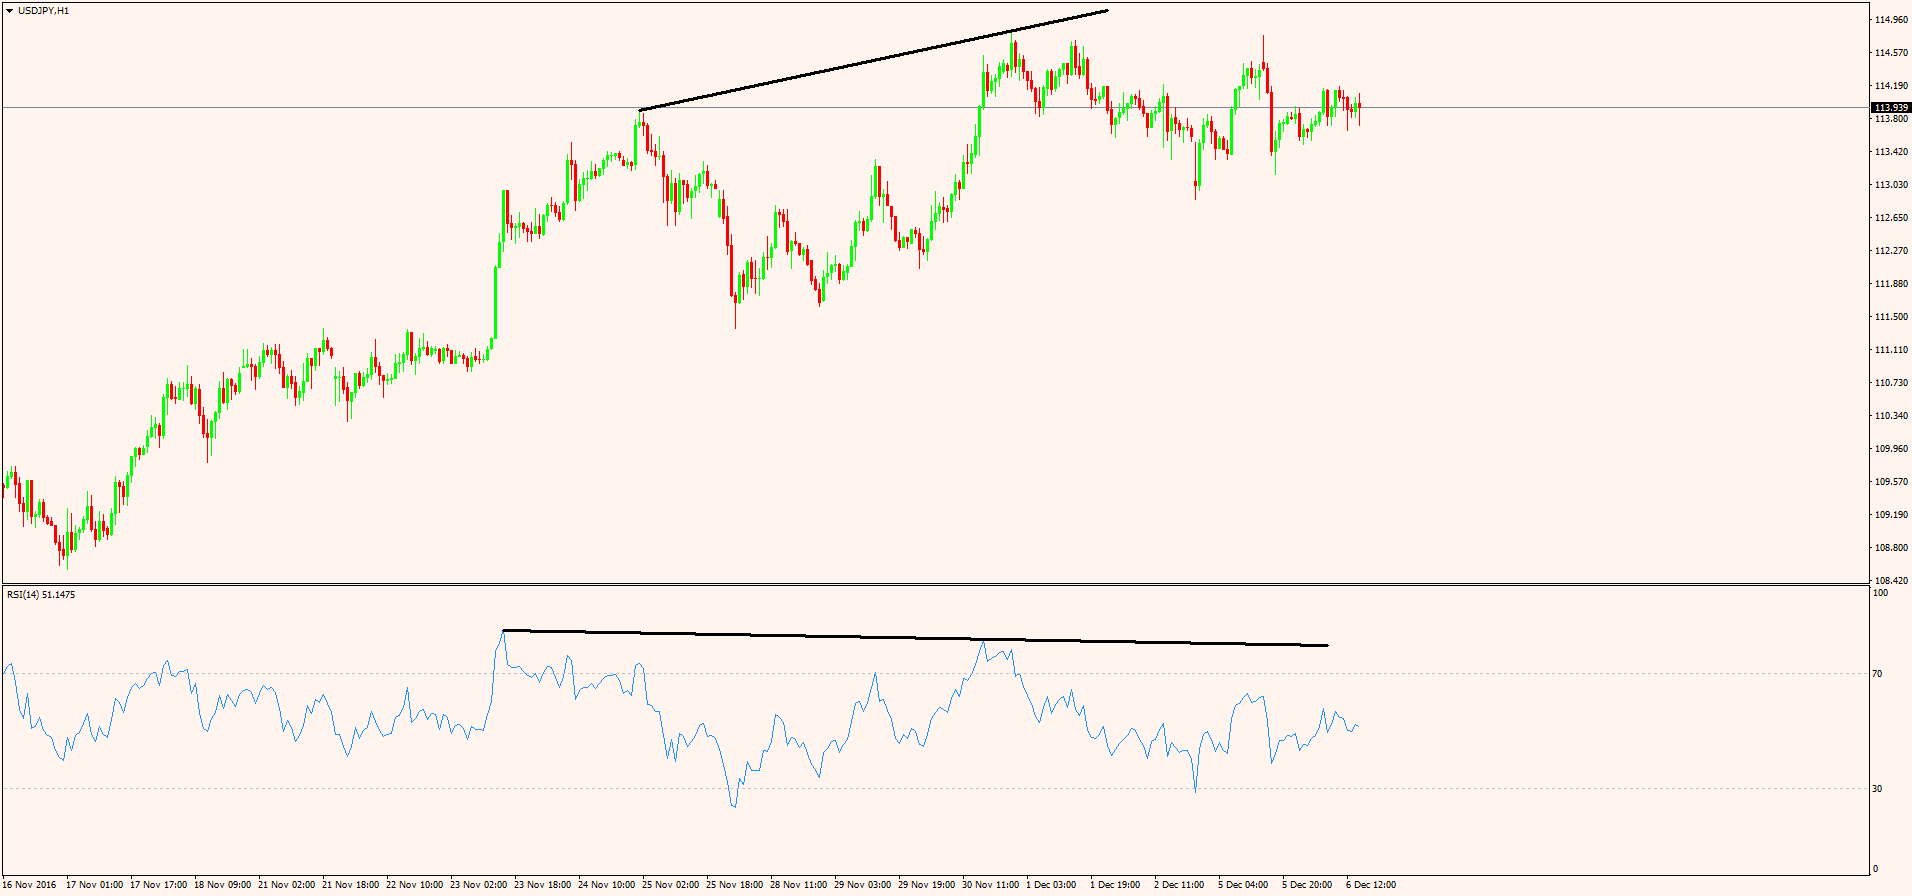
Finally, the USD/JPY hourly chart shows a bearish divergence that reached the take profit a couple of days ago. There appears to be no other signal on this timeframe right now.
To sum up the USD/JPY top-down analysis based on the RSI bullish or bearish divergences, there is one short active trade based on the 4-hour timeframe that still needs to reach take profit. However, if on the shorter timeframe, the hourly chart, a bullish divergence forms, the long trade should be taken. The advantage of doing that is that the account is hedged (this effectively means that the balance and equity in the trading account will remain the same) until one of the two trades reaches the take profit. Moreover, the freed margin can be used for taking other trades on another currency pair.
Repeating the Same Model
As you can tell from the examples above, there is only one active trade, even though we ended up looking at five different timeframes. However, the same model can be used on other currency pairs, and in this way more trades can be taken. The big catch here is to fully understand that if a signal appears on any one of the timeframes mentioned in the top-down analysis, it must be taken. Otherwise, the whole system becomes an arbitrary one, and randomness replaces discipline and logic. The RSI system used in these examples is only that: an example. Any system can follow the same approach, and at one moment in time multiple trades can be open, in the same or different directions, on the same or different currency pairs, resulting in the trading account being either fully, partially, or correlated hedged. (For more about what fully, partially or correlated hedged accounts are, please revisit the previous article here on the Forex Trading Academy project.)
Again, even if hedging is restricted in some parts of the world, it doesn’t mean that hedging as a money management technique cannot be used. It increases the chances of winning on the Forex market and, in a way, it results in analysis of multiple currency pairs, so that the overall general direction of the market is better understood. It is said that the Forex trader needs to put in the “screen hours”, and this is a good example to demonstrate what this means.
With this, the risk management section in our project has ended, and we’ll move on to the last part dedicated to the multiple tools and resources to be used for making your life easier when trading Forex. Keep in mind that a multiple-timeframe analysis is always better than a single-timeframe one, and the examples offered in this article show that clearly.
Other educational materials
- Composite Index
- Toronto Stock Exchange (TSX)
- The Importance of Press Conferences
- Forex Trading When Central Bankers Hold Speeches
- Profit from Forex Trading Using Different Trading Styles
- How to Set Up an Expert Advisor
Recommended further readings
- “Asset allocation with hedged and unhedged foreign stocks and bonds.” Jorion, Philippe. The Journal of Portfolio Management 15, no. 4 (1989): 49-54.
- “Mean/variance analysis of currency overlays.” Jorion, Philippe. Financial Analysts Journal 50, no. 3 (1994): 48-56.
Related Articles