Trade the Apex of Contracting Triangles in Forex

| Broker | Bonus | More |
|---|
Three Ways to Use the Apex of a Contracting Triangle
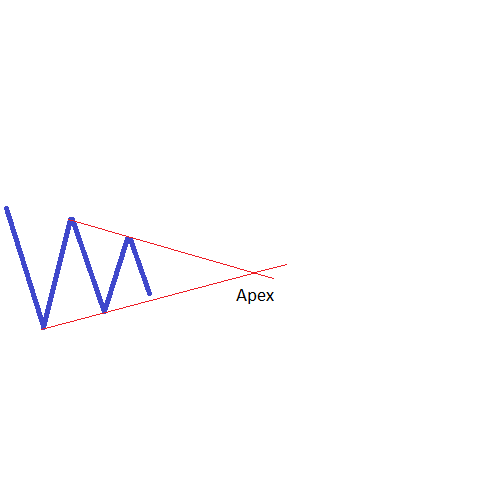
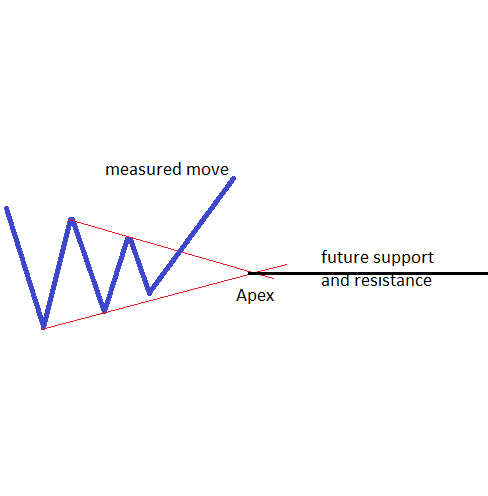
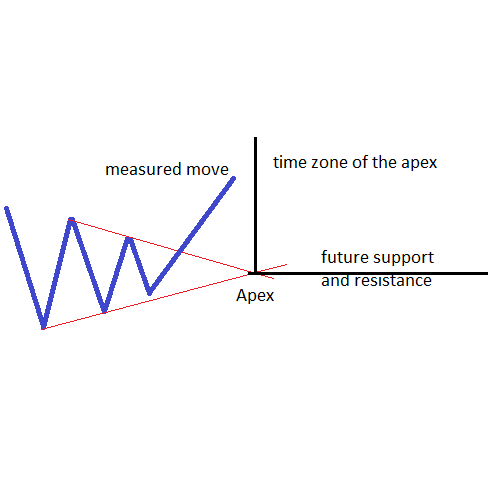
Just to be sure we’re on the same page, the apex of a contracting triangle represents the intersection point of the two trendlines that make the triangle: the a–c and b–d ones. It can be used for identifying future support and resistance levels, just like in the case of an expanding triangle, but also to find out the measured move when the price breaks, as well as the time when that target should be reached.
Support and Resistance Levels
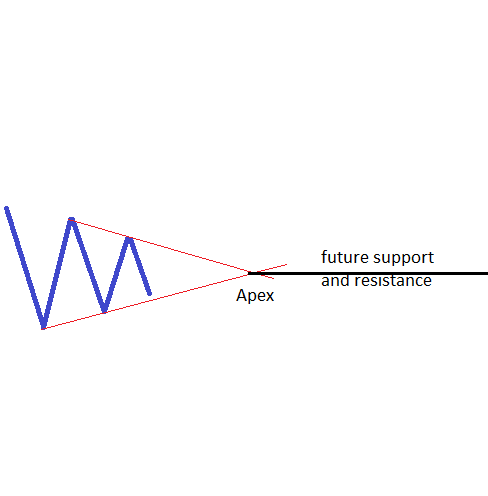
Perhaps the most important way to use the apex is to find out future support and resistance levels that the market will form. This is only valid, though, when the apex can be identified relatively close to the actual triangle. Otherwise, if the two trendlines are almost parallel, the apex is of no use for the overall market interpretation. After the a–c and b–d trendlines have been drawn, the thing to do is to project them onto the right side of the chart in order to find out the apex. Once that is in place, a horizontal line should be drawn. This line represents the overall support and resistance level for future prices, and gives a pretty good idea of what to do when future prices reach the apex level. In other words, if the price breaks higher out of a contracting triangle and then reaches the apex level, it is not wise to stay on the short side any longer. I’m not saying one should go long, but at least shorts should be closed on such a move, as it is most likely that a bounce is about to come.
Find the Measured Move of a Triangle
A triangle, like other patterns, can be either a continuation or a reversal pattern. If it is a continuation pattern, the contracting triangle can be a pennant or part of a complex correction that will eventually break in the same direction as the direction prior to the triangular formation.
On the other hand, when contracting triangles form as part of complex corrections, they usually form at the end of the correction, and are therefore reversal patterns. In both cases, a measured move can be calculated based on the type of the triangle. This measured move is strongly related to the longest leg of the contracting triangle. In such a triangle, the longest leg can be either the a-wave or the b-wave.

Price and Time with the Apex
As a continuation of the previous paragraphs, the apex gives the time element for a trade to come to fruition. Time is an extremely important element in trading, and Elliott found a great way to integrate it into the overall theory.
For years, the interplay between price and time was (and it still is) the holy grail in trading. Knowing how to put a time on a price forecast is as important as, if not even more important than, the actual forecast. 
Trading with the apex of a contracting triangle is a rewarding way to identify both reversals and continuation patterns in the Forex market. While some may look at the apex as not being that important, a correct analysis and interpretation of a contracting triangle can only be made by taking its apex into account. The next article here on our Forex Trading Academy will deal with different types of contracting triangles, and one should consider all the ways the apex of these triangles can be used. Only in this way can a complete technical analysis of a contracting triangle be carried out.
Other educational materials
- Defining Impulsive Waves
- Defining Corrective Waves
- Use the Fibonacci Extension Tool in Elliott Waves Theory
- Different Fibonacci Levels Important When Trading with Elliott
- Trading Different Types of Extended Waves
- Placing Pending Orders When Trading with Elliott
Recommended further readings
- “Insider Trading (PLI 2d ed. 2006).” Wang, William KS, and Marc I. Steinberg. (2006).
- “Stock Market Insider Trading: Victims, Violators and Remedies-Including an Analogy to Fraud in the Sale of a Used Car with a Generic Defect.” Wang, William KS. Vill. L. Rev. 45 (2000): 27.


