In technical analysis, triangles can be either contracting or expanding. So far on our Forex Trading Academy project, we’ve mentioned both expanding and contracting triangles in the sense that we defined what makes them, and showed how to trade them both based on the apex level. Moving forward, a further differentiation needs to be made. Both contracting and expanding triangles are of multiple types, and this article is dedicated to the types of contracting triangle. As a short revision, a contracting triangle is characterised by five different segments, or legs of a triangle, that form in such a way that by connecting the a–c and b–d trendlines, the result will be a common point somewhere in the future. The standard definition calls for all the legs of a contracting triangle to be smaller than the previous one, but this is only the general rule. In reality, there are some variations, and this is how contracting triangles are further subdivided.
Three Types of Contracting Triangles
Elliott found that there are no less than three types of contracting triangles. This information is only partly true, as later in our project we will point out some other contracting triangular formations. These three types, though, can be categorised as the commonest ones, and the main differentiation is based on the length of the triangle’s segments. That being said, as long as the a–c and b–d trendlines are contracting, the triangle is contracting. In any triangle, the key is always with the b–d trendline. This trendline is far more important than the a–c one, as it shows the end of the triangle and the beginning of what may be a new trend.
Horizontal Contracting Triangle
This is by far the most common type of a contracting triangle. In such a pattern, all the waves that follow the a-wave are smaller than the previous wave, and this results in the contracting aspect of the triangle. The very definition of such a triangle is therefore a>b>c>d>e.
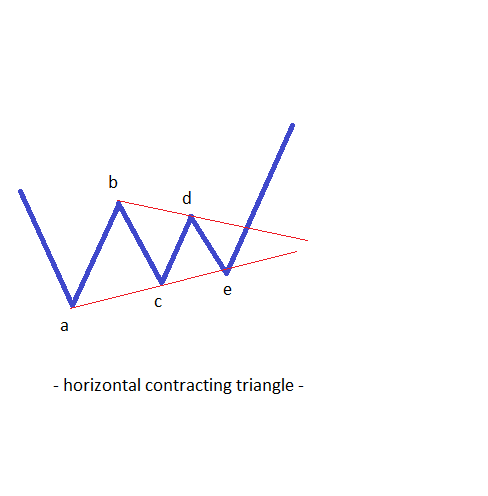
The name of such a triangle comes from the fact that it is evolving on the horizontal and, starting from its beginning, the price will form a series of ups and downs around that level until eventually they will break higher or lower. Horizontal contracting triangles may appear as the b-wave of a zigzag or as the fourth wave in an impulsive wave, and also as part of a complex correction. Out of these three possibilities, look for them to form mostly as part of a complex correction; and when this happens, they’re most likely to be the last part of that correction.
Irregular Contracting Triangles
An irregular contracting triangle is still a contracting one, so the a–c and b–d trendlines point towards a common point, but there is one difference when compared with the horizontal one: The b-wave is bigger than the a-wave. This makes it very difficult to correctly interpret and identify such a triangle, and it is usually only visible after the c-wave is completed. Because the b-wave is the longest one, the measured move of this triangle should be calculated based on its length, which can sometimes be even more than 161.8% of the b-wave. This calls for a tremendous break, and missing that break may be costly for any trader. There is an entire debate regarding the horizontal nature of both irregular and horizontal triangles. The idea behind this debate is that the irregular triangle is a horizontal one as well, as it forms on the horizontal, despite the fact that the b-wave is actually longer than the a-wave.

From my point of view, because both of them in the end evolve on the horizontal, they should both be classed as horizontal triangles. However, this is just a semantic thing, and it should not have any influence on the overall technical analysis picture. While horizontal contracting triangles are the commonest triangles, it should be mentioned here that irregular ones form pretty often on the Forex market. This market is characterised by a lot of fake moves, and therefore when the b-wave exceeds the end of the a-wave in such a triangle, it is most likely a fake move destined to attract traders to the wrong side of the market.
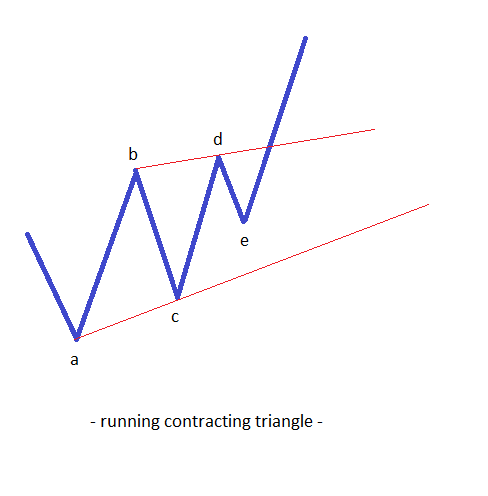
Running Contracting Triangle
This triangle falls into a very special category due to the fact that its end point will be above (in the case of a bullish triangle) or below (in the case of a bearish triangle) its starting point. Moreover, “running” means a pattern that will be followed by a powerful break after the triangle is broken, so the b–d trendline is the one that holds the key for any entry. In such a triangle, not only is the b-wave bigger than the a-wave, but the d-wave is also bigger than the c-wave. Therefore, when compared with the overall general definition of a contracting triangle, we have two waves that defy the norm, namely the b-wave and the d-wave. Still, in this pattern, the b-wave is the longest one of all the waves that make the triangle, and the e-wave is the smallest one. Such a triangle appears mostly at the end of complex corrections, such as double or triple combinations, as these patterns are the most likely to end with a triangle.
Regardless of the type of the contracting triangle that forms, traders should focus on the most important trendline: the b–d one. The nature of this trendline has many implications for future price action, as well as for what the price does after it breaks. For example, in a triangle that is not supposed to be followed by a strong move, the b–d trendline should not be retested until the measured move of the triangle is completed. On the other hand, in a triangle that is part of a complex correction, the b–d trendline is usually retested after it is broken. The a–c trendline has an important role as well, as it is rarely that this trendline is a clean one. Usually, the price breaks it between the two points that make up the trendline, and if that does not happen, the whole triangular formation should come with a big question mark regarding its interpretation. All in all, look for contracting triangles all over the place, and depending on the type of the triangle one should have an idea about the future price action to follow. Knowing all the possible types of triangle the market can form helps the trader in deciding what the triangle stands for, where to start/end the count, and what the overall Elliott Waves theory is telling about future price action.
Other educational materials
- The All-Important B Wave Retracement
- What Are Corrective Waves?
- Trade Forex with Simple Corrections
- Complex Corrections in Elliott Waves Theory
- Types of Flat Patterns
- Types of Zigzag Patterns
- Contracting and Expanding Triangles
Recommended further readings
- A Geometric Interpretation of Trade Measures. Elliott, R. and Azhar, A., 2004. Economic Integration and the Evolution of Trade: Journal of Economic Integration, 19(4), pp.651-666.
- Trade what you see: how to profit from pattern recognition Pesavento, Larry, and Leslie Jouflas. . Vol. 302. John Wiley & Sons, 2010.
Related Articles