Technical analysis started to grow in the Western hemisphere as more and more traders became interested in reasons why markets turn, other than the classical fundamental aspects. This was happening at a time when trading was mostly done on the stock market, as free-floating currencies were scarce in those days. As a result, classical patterns representative of the technical analysis field have become popular, such as the head and shoulders pattern, the pennant, the bullish or bearish flag, the double and triple bottom, the rising and falling wedge, to name a few. After a while, though, Westerners were taken by surprise by the power of a new approach to technical analysis. Such an approach came from the other side of the world, namely from Japan. For hundreds of years the Japanese used candlestick charts to keep track of fish and rice prices, and, in doing so, the so-called Japanese Candlesticks techniques were developed. Until then, Westerners used line and bar charts to keep track of price movements, but they quickly embraced these new candlestick charts because candles tell much about the next price action to follow. So powerful are the Japanese Candlestick techniques that they were quickly embraced, and are now part of everyday technical analysis.
Trading with a Hammer/Hanging Man
Before moving on to actual candles/group of candles to identify reversal patterns, it is worth defining a candle and its elements, and also what makes up a group of candles. A candle is defined by the following factors:
- It has an opening and a closing price.
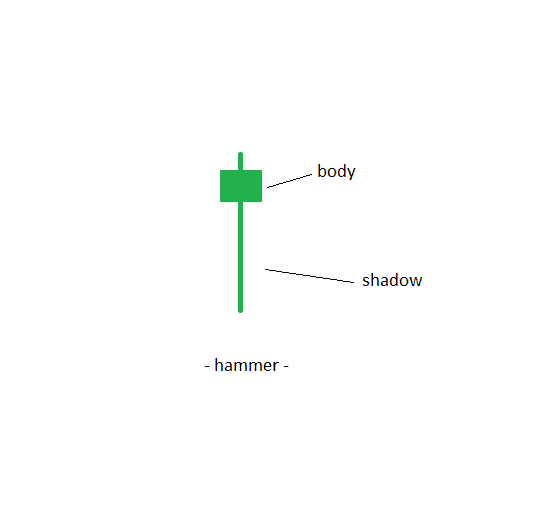
- It has a body.
- It has a shadow.
A candle shows the timeframe that the trader chooses when making the technical analysis study. If this is a monthly chart, a candle will represent 1 month. This means that the opening price of the candle is the price at the start of the month, while the closing one is the price at the end of the month. Japanese Candlestick techniques are mostly reversal patterns, and they refer to either one or a group of candles (two or three candles). Of those, the most representative one is the hammer/hanging man.
Defining a Hammer/Hanging Man
A hammer is a reversal pattern formed from a single candle, and represents one of the most powerful reversal patterns to be formed under the Japanese Candlesticks technique. It is worth mentioning here that a hammer is a bullish reversal pattern, and will therefore only appear at the end of a bearish trend.
The opposite of a hammer is called a hanging man and, it goes without saying, it will form at the end of a bullish trend because it is a bearish reversal pattern. For the sake of not repeating the same thing twice here, we will refer here to the hammer and, to apply the same principles when trading a hanging man, you only need to look for the opposite factors. Having said that, a hammer is one candle that has a huge shadow and a small body. The body can be either green or red (these two are the colours usually associated with bullish or bearish candles), but it doesn’t matter for the overall interpretation of the hammer.
Interpreting a Hammer

When interpreting a hammer or a hanging man candlestick pattern, it is important to keep in mind that they represent a battle between two main forces: In the case of a hammer, bears are dominating the price action as the previous trend is extremely bearish. It means that bears are not going to give up so easily. In plain English, in trading this means that it is not wise to buy right at the moment that the hammer candle closes, but better to wait for a small retracement, as bears are going to try to push to take the lows defined by the lower part of the shadow. This almost always happens, and in doing so, a better entry for the bullish trend is to be found.
The chart above shows a nice hammer candle forming after a bearish trend, and the body of this candle is a green one. Again, it makes no difference whether it is a green or a red one. What matters is the shadow of the candle: The bigger the shadow, the more powerful the hammer will be. As you can see on the chart above, it is not wise to go long right at the close of the hammer candle, as bears will almost always push for another low, and, in some cases, they will succeed in making a new low. The stop loss for any long trade should therefore be at the lower part of the hammer. Because one is supposed to enter such a trade only after a meaningful retracement into the territory of the hammer (38.2% minimum), the stop loss is not that big, and a nice risk/reward ratio will assure overall profitability in the long run. This ratio should be minimum of 1:3, and this means that for every pip that is risked, 3 pips of profit are being targeted.
Trading a Hanging Man
As mentioned earlier, trading a hanging man should be the same as trading a hammer candle, the only difference being that a hanging man is a bearish reversal pattern, therefore forming at the end of a bullish trend. In this case, the trade should be a short one, with a stop loss at the top of the hanging man, and a take profit that should have a minimum 1:3 risk reward ratio. For both hammers and hanging man candles, the timeframe is important. As a rule of thumb, due to high-frequency trading, last year saw these patterns losing their significance on shorter timeframes such as the hourly one, but starting with the 4-hour chart and longer, they are significant. All in all, knowing when a hammer/hanging man is forming on a longer timeframe is crucial as it is the signal that the overall trend is about to change. The way to go is to wait for a small pullback before taking a chance on a trade in the opposite direction, as described in this article.
Other educational materials
- Japanese Exchange Group (JPX)
- LSE – London Stock Exchange
- NASDAQ
- The Importance of Press Conferences
- Forex Trading When Central Bankers Hold Speeches
- How to Trade with Gartley
Recommended further readings
- “Charts, noise and fundamentals in the London foreign exchange market.” Allen, Helen, and Mark P. Taylor. The Economic Journal 100, no. 400 (1990): 49-59.
- “Does the momentum strategy work universally? Evidence from the Japanese stock market.” Liu, Chunlin, and Yul Lee. Asia-Pacific Financial Markets 8, no. 4 (2001): 321-339.


