British Pound Continues to Struggle

- Fails at first signs of resistance
- 8% Fibonacci retracement level being tested again
- Overall US dollar strength is showing
The British pound continues to struggle in general: it initially rallied during the trading session on Wednesday, but then gave back the gains almost as soon as it hit the first signs of resistance. The 1.23 level has been important lately, and it now looks as if traders will continue to focus on that level. All things being equal, the 1.22 level offers significant support at this point, and will be paid close attention to now that the candlestick is starting to press that area again.
Continued Brexit noise
The noise coming out of Brexit continues to be deafening, with the DUP stating that they clearly oppose the reported EU compromise on the Northern Ireland scenario. We are still more than likely going to see a no-deal Brexit scenario. There has been no serious attempt by either side to move the ball forward, so this continues to punish the British pound. This is at least until we finally get confirmation of one thing or another, after which it’s probably going to be the value play of a lifetime.
Technical setup

GBP/USD chart
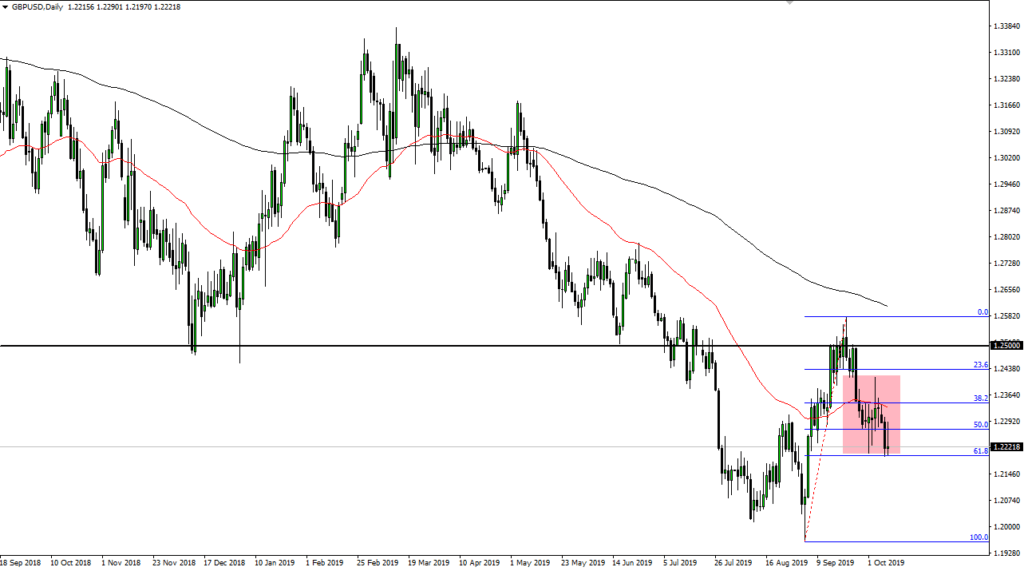
The technical setup for this pair is interesting, as the market has been trading in a 200 PIP range between the 1.22 level on the bottom and the 1.24 level above. The 50-day EMA is slicing through the middle of that and turning lower, indicating that there is more downward than upward pressure. This makes sense when you look at the longer-term trend. Beyond that, the 61.8% Fibonacci retracement level sits just underneath, so a break down below it would more than likely open up another 200 pips to the downside. Frankly, that is the easiest thing to believe, looking at the longer-term chart.
The alternate scenario would be that the market rises back towards the 50-day EMA. This is technically possible because so many algorithms are trading this market, now that Twitter headlines have fooled machines into buying and selling occasionally. That being said, though, it now looks as if the 50-day EMA could be a good signal to start selling again, based on any signs of weakness.
Looking at the technical analysis, there is no reason to think that we are going to get a sudden turnaround in pressure and momentum. It also looks very likely that, given enough time, the 1.20 level will be tested again. For what it’s worth, as a general rule, once you break down below the 61.8% Fibonacci retracement level, more often than not the market will go looking towards the 100% Fibonacci retracement level. All things being equal, that looks to be the most likely scenario going forward.

