Kiwi Dollar Overstretched Against Canadian Dollar

- NZD/CAD above upper Bollinger Band
- Testing 38.2% Fibonacci
- Major downtrend still intact
The New Zealand dollar rallied significantly during the trading session on Friday, reaching towards the 0.85 CAD level. Ultimately, this is a market that is trying to form a larger bottoming pattern, but at this point, it’s very likely that the simple weight of the market should continue to cause issues given enough time. The market currently looks very likely to find some trouble.
Technical analysis
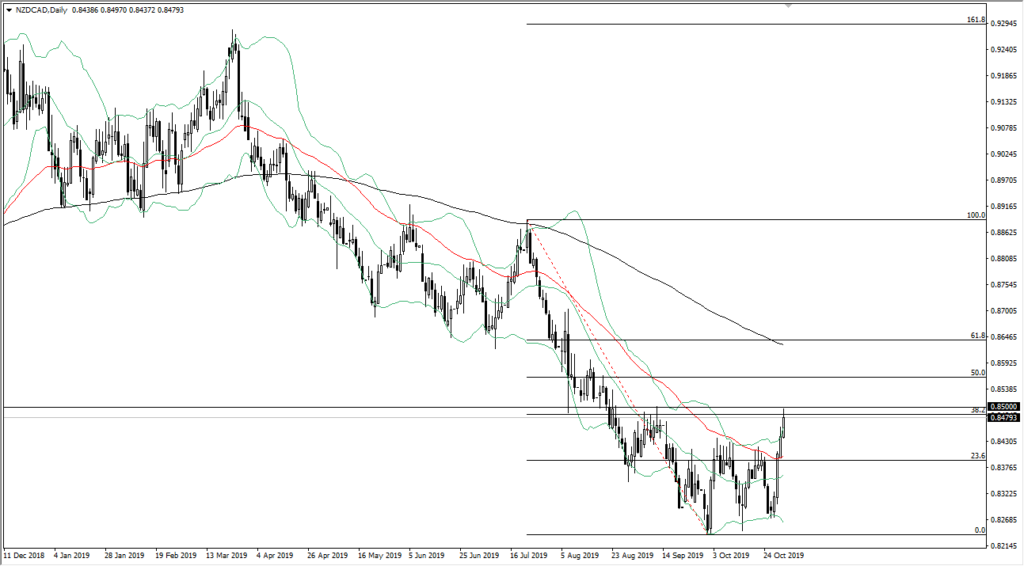
NZD/CAD chart
The NZD/CAD pair rallied rather significantly on Friday, just as it did during the previous couple of sessions. However, gravity eventually comes into play, and this causes us to look at this chart with some level of suspicion.
The market is currently testing several different things that could drive it lower, such as the 38.2% Fibonacci retracement level that’s sitting at current pricing. Beyond that, the 0.85 level is a large, round, psychologically significant figure, and that attracts a lot of attention as well.
The Bollinger Band indicator is stretched, and the market has broken well above the top of the upper band. That suggests that we are getting far away from what would be considered “normal”. It appears that the market is likely to roll over at this point, and any sign of exhaustion will probably be jumped on as it would go with the longer-term trend overall.
Beyond that, the 200-day EMA is above, and it’s starting to race towards the neighborhood that the market is trading in right now.
There is also a significant amount of clustering from the last time we were near the 0.8580, firing off several shooting stars. This shows just how important this level should be, and as the market has been in such a freefall, the fact that the 38.2% Fibonacci retracement level would cause resistance makes quite a bit of sense.
Even if it doesn’t, the 0.8550 level then features the 50% Fibonacci retracement. It’s then likely that the market would also see the 200-day EMA come into play as well.
At the moment, the downtrend is still very much intact, despite the fact that the market has been so bullish over the past week or so.
Background noise
Keep in mind that the New Zealand dollar is highly sensitive to US-China trade relations and the Asian economies in general. As we are starting to see some consolatory tones between the Americans and the Chinese, this may be part of the reason the Kiwi dollar has rallied a bit.
However, we also have noise on the Canadian side, as the Canadian dollar is so highly sensitive to crude oil. If crude oil rallies, that will quite often put downward pressure in this pair. In other words, there are a lot of potential tweets that could come into play and move the New Zealand dollar, just as crude oil action can move the Canadian dollar.
All things being equal though, following the trend makes the most sense.

