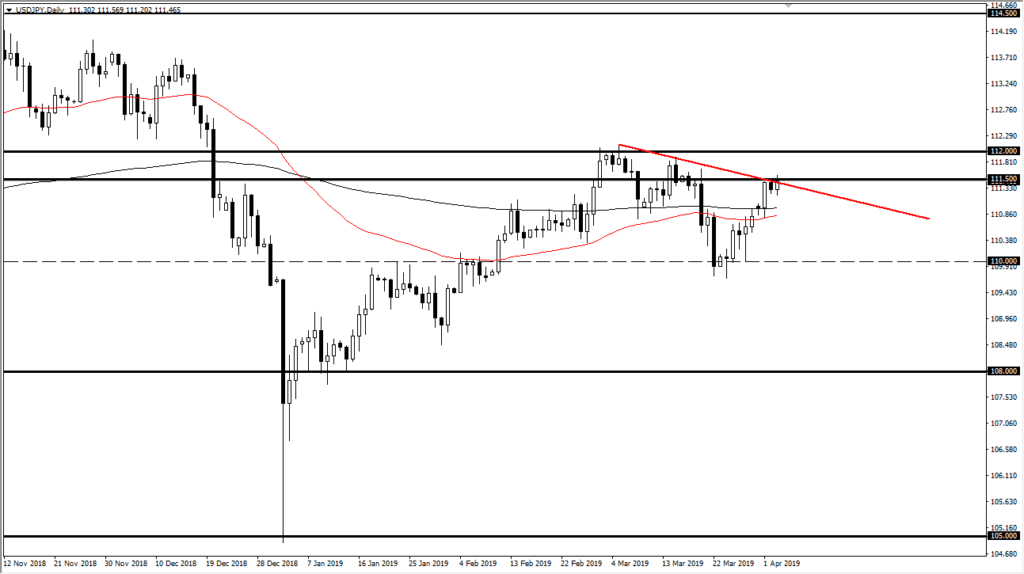
US dollar pressing resistance against Japanese yen

The US dollar rallied a bit during the trading session on Wednesday as we continue to grind towards the 100 level ¥0.50 level. This is an area that began significant resistance and should be paid attention to. Because of this, this pair could give us a bit of an insight as to where the greenback is going forward which of course is always crucial when trading Forex markets.
Major barrier
There is of course a major barrier at the ¥111.50 level, which extends all the way to the ¥112 level quite easily. Because of this, it will take a certain amount of wherewithal and momentum to send this market higher and cause a break out. Once we get above the ¥112 level, the market could then go looking towards the ¥113.50 level, the scene of the previous strength in the Japanese yen. That selloff in this pair started the whole move lower. Obviously, there should be a lot of supply in that region.
Beyond that, we also have the minor downtrend line drawn on the chart but having said that we also have major moving averages underneath that should continue to lift this market. The 50 and the 200 day EMA indicators are both at roughly ¥110.75 underneath.

USD/JPY cahrt
Are we just range bound?
Another way to look at this chart is that perhaps we are trying to carve out a new range. That would of course feature the ¥111.50 level on the top and the ¥110 level on the bottom as we have recently seen a lot of buying in that area. It would make quite a bit of sense as the S&P 500 reaches towards a major resistance barrier and is showing a proclivity to chop around in this region. This pair tends to follow that market overall, so as the two situations line up so nicely, it’s kind of hard to ignore that correlation at this point in time.
It looks as if the S&P 500 could pull back from here, but it is well supported at the 2790 handle. Looking at both charts, I believe that the 2790 level is a proxy for the ¥110 level on this pair, so as one goes, the other will more than likely follow. A break down in one of them will probably cause a breakdown in the other in a bit of “risk aversion.”
Is the US dollar overbought?
Another question that you should be asking yourself is whether or not the US dollar is overbought at this point. The Euro is trading near the 1.12 level but is starting to show signs of life as the US dollar softens its grip. It’s possible that the US Dollar Index will stay below the 97 handle, and if it does that should help as well. Quite frankly, the greenback has gotten way ahead of itself as the Federal Reserve is looking to sit on the sidelines or at least the rest of the year. That could give the market the ability to pull back from here and start this range.

