Guide to Flat Patterns in Waves Structures
Flats are corrective structures that are labelled with letters: a-b-c. The first two waves in a flat pattern are corrective, so they are three-wave structures, while the c wave is always an impulsive wave. Because of this, a classical flat structure is a 3–3–5 one. Waves a and b can be either simple or complex corrections, while the c wave is a five-wave structure with either a third, first or fifth-wave extension. The key to interpreting a flat pattern lies with the b-wave, though. Based on the retracement level of the b-wave into the territory of the previous a-wave, we have many types of flats. They are divided into three main categories, each of which has more than two types of flats that fit into it.
| Broker | Bonus | More |
|---|
The Key Remains with the B-Wave.
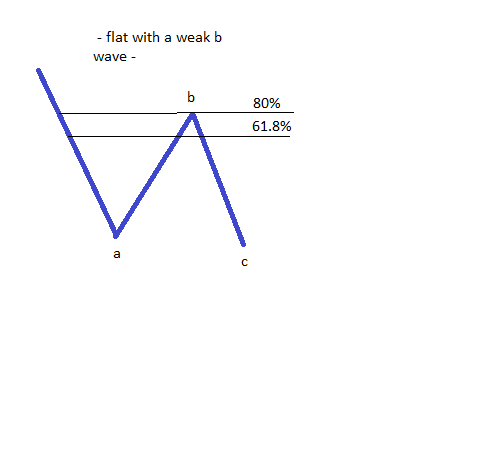
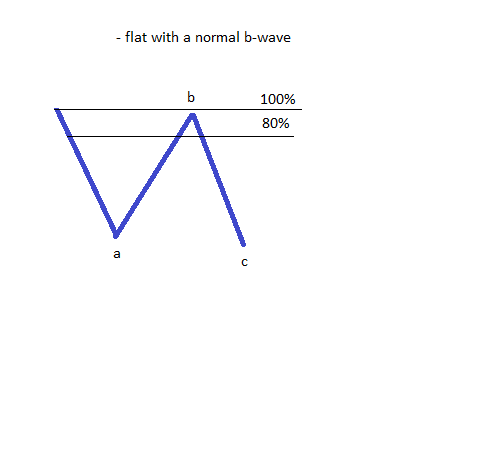
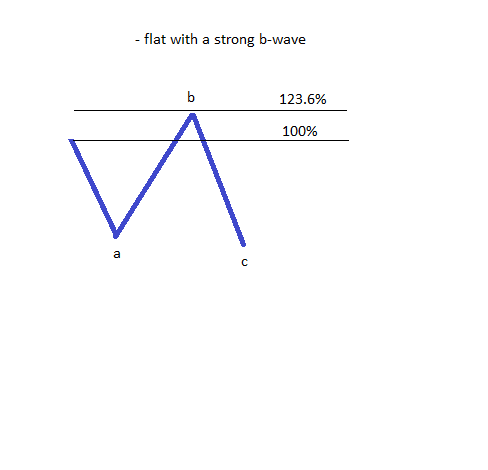
As you should know by now from other articles in our Forex Trading Academy, a flat always has the b-wave retracing more than 61.8% of the previous a-wave. In order to find out exactly where that level is, one should take a Fibonacci Retracement tool and drag it from the start of the a-wave to the end of it. Moreover, there are other levels to be considered as well, and they can be added to a Fibonacci tool. To add a level, the Fibonacci tool should be selected, then the Levels tab should be used to add the desired value. We are interested in adding the 80% and 123.6% retracements. These are the other Fibonacci levels that matter for a flat pattern, as covered in the article dedicated to the Fibonacci retracement tool.
Flats with a Weak B-Wave

- The first possibility is that the c-wave fails to take the lows in the previous a-wave, and so is smaller than the b-wave. Such a pattern is really powerful, and shows a move in the opposite direction of the flat to come in quite an aggressive wave.
- The next possible length of the c-wave is to take the lows in the previous a-wave, but to fail to move more than 123.6% when compared with the length of the a-wave. Therefore, you should just measure the length of the a-wave, find the 123.6% extension, project it from the end of the b-wave, and you’ll have an educated idea of where this type of flat will end its c-wave.
- Last but not least, if the c-wave is a really strong impulsive wave that moves well beyond the 123.6% level (ideally beyond the 161.8%), the whole a–b–c pattern is becoming elongated. This is important as it signals that a bigger consolidation of larger degree might be in cards.
Flats with Normal B-Waves

- The c-wave fails to move beyond the end of the previous a-wave. A very powerful flat forms when this happens, and this usually calls for a sharp move in the opposite direction of the flat. This means that if the flat is a bearish one, a sharp move higher will begin.
- The c-wave ends beyond the end of the previous a-wave, but no more than 123.6%. Moderate flats fall into this sub-category, being part of either a complex correction or individual simple corrections such as a second or a fourth wave in an impulsive wave, or a b-wave in a zigzag, or a flat pattern of a larger degree.
- The c-wave ends beyond 138.2%. This is by far the most aggressive scenario for the c-wave, and again it calls for a range or consolidation on a bigger degree.
Flats with a Strong B-Wave

- The c-wave fails to completely retrace the b-wave. This only happens if the b-wave is so strong that it stretches well beyond the 123.6% level mentioned above. The stronger the b-wave, the more alike waves a and c will look.
- The c-wave ends beyond the end of the previous a-wave, but not more than 123.6% of it. This is a flat that is quite rare, despite the fact that many Forex traders consider such a pattern.
- The c-wave stretches more than 138.2% beyond the end of the a-wave, and, as was the case with the previous categories, it signals a consolidation on a larger degree.
Knowing what type of flat the market is forming is vital for the overall interpretation of Elliott Waves theory. There are situations when it is not possible for a specific pattern to form unless it contains a specific type of flat. One can therefore trade such a pattern with quite some confidence. Of all the three types of corrective wave (flats, zigzags, and triangles), flats are the most numerous, and the most complicated. The following article will be dedicated to the types of the zigzags that exist, and how to interpret them based on both the retracement level of the b-wave and the length of the c-wave to follow.
Other educational materials
- Trading with the Apex of a Contracting Triangle
- Types of Contracting Triangles
- Special Types of Triangles
- Types of Expanding Triangles
- Trading with X Waves
- The Concept of a Running Correction
Recommended further readings
- Technical analysis of the financial markets: A comprehensive guide to trading methods and applications. Murphy, John J. Penguin, 1999.
- “Prediction Models of Financial Markets Based on Multiregression Algorithms.” Wilinski, Antoni. The Computer Science Journal of Moldova 19, no. 2 (2011): 178-188.


