One of the biggest discoveries Elliott made was to realise that not all corrections are simple, but some are actually complex. As a matter of fact, at least when it comes to the Forex market, we see more complex corrections than simple ones, and therefore there is a stringent need for traders to understand how complex corrections form. The cornerstone of every complex correction is the x-wave, or the connecting/intervening one, and its role is to build a bridge between two or more simple corrective waves. In reality, there can only be two or three simple corrective waves, and this means that the maximum possible number of x-waves is two.
An x-wave is always a corrective wave in its own right, whether a simple or a complex one, and should be treated as such. The problem with x-waves is that traders fail to realise that their structure is of a lower degree. Let me give you an example. Assuming the first correction is a flat, then the move that retraces that flat is actually the x-wave. We do know by now that flat patterns are labelled as a–b–c, so the x-wave should have the same degree as the first a–b–c. However, we also know that in a flat, waves a and b are corrective, and the c-wave of a lower degree is impulsive. Therefore, a proper count should be (a–b–c) – (a–b–c) – (1–2–3–4–5) for the flat, and then the x-wave follows. The structure of this x-wave must be a corrective one of a lower degree, exactly like in the case of the previous flat.
How to Trade an X-Wave
There are several things a trader can do when it comes to trading an x-wave, and they do lead to successful and profitable trades. Sometimes, though, it is more important to be right on the overall pattern and Elliott Waves count than to have a profitable trade. It means that future trades will have a greater chance of being on the right side of the market, and this is why the focus should be on the overall analysis and not on any single trade. This is where Elliott Waves works best!
Trading the First X-Wave
Any complex correction has at least one x-wave, and therefore interpreting the first one is key for the overall analysis. This is important as, if the complex corrections are actually forming on a longer timeframe, then the retracement levels are quite significant. There is a saying in trading that “Bearish market rallies are even more powerful than bullish ones”. This cannot be truer than in the case of x-waves, as if the first correction is a bearish one, then the x-wave retracement can be quite aggressive. According to Elliott, there are two types of x-waves, and they are interpreted based on the retracement they make into the territory of the first correction. Attention is required here: The retracement is compared to the overall first correction, not to the previous segment. What a trader needs to do is to take a Fibonacci Retracement Tool (which any good trading platform provides) and use it to measure the length of the first a–b–c. If the x-wave ends beyond the golden ratio (61.8%), then the complex correction is one with a large x-wave. On the other hand, if the x-wave ends before the 61.8% level is reached, the complex correction falls into the category of complex corrections with a small x-wave. This is all that we need in order to trade the first x-wave in a complex correction.
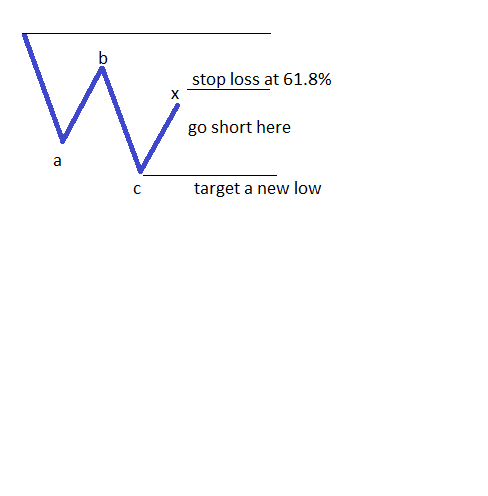
The thing is that x-waves rarely go more than 38.2%–50% into the territory of the first correction, and this gives the entry for a trade in the same direction as the previous correction. The stop loss for the trade should be at the 61.8% level, and if triggered it means the correction will have a larger x-wave. The take profit in the first instance should be at a minimum the end of the first correction, and sometimes a Fibonacci ratio is used as well in order to identify the perfect exit. On the other hand, if the 61.8% level is reached, the idea is to reverse the original trade and to take one in the opposite direction of it, targeting a full retracement of the first correction.
Trading the Second X-Wave
When it comes to the second x-wave, things are simpler and more straightforward. The thing is that by this time we already know the nature of the first x-wave, and the second one must be similar. There is no other way around it! It is not possible to have a small x-wave for the first intervening wave and then a large one for the second one. This gives us a great leverage tool against the market, as we can insist on the same direction with a more aggressive trading plan than the one used on trading the first x-wave. The idea behind it is pretty similar, though. Finding the 61.8% is mandatory here as well, as it is not possible for the x-wave to end beyond this level. But what should the retracement refer to? It does not refer to the second corrective wave, and that is the level we need to measure. Because the x-wave cannot end beyond 61.8%, there is really only a small chances of the price travelling to that level.

Nevertheless, the stop loss should be around 80% when compared with the second correction, as parts of the x-wave can indeed exceed the golden ratio. As a target, the market definitely needs to move beyond the end of the second correction, and this trade should be more aggressive than the one caused by the first x-wave. Keep in mind, though, that by the time the market moves beyond the end of the second correction, it is not wise to stay in that trade anymore. The reason for this is that this is the way to make the most out of this second trade. As you can see, trading an x-wave is not that complicated as long as the rules of engagement are respected, and then traders know what to expect next. This is the only way to trade complex corrections and, based on the fact that they form pretty often, it is surely the way to succeed when trading the Forex market.
Other educational materials
- Different Fibonacci Levels Important When Trading with Elliott
- Trading Different Types of Extended Waves
- Placing Pending Orders When Trading with Elliott
- How to Trade 2nd and 4th Waves
- The All-Important B Wave Retracement
- What Are Corrective Waves?
Recommended further readings
- Elliott Wave Theory and neuro-fuzzy systems, in stock market prediction: The WASP system. Expert Systems with Applications Atsalakis, G. S., Dimitrakakis, E. M., & Zopounidis, C. D. (2011). 38(8), 9196-9206.
- “Technical analysis for portfolio trading by syntactic pattern recognition.” Pau, Louis-François. Journal of Economic Dynamics and Control 15, no. 4 (1991): 715-730.


