Trader’s Tips for Using the Ichimoku Cloud
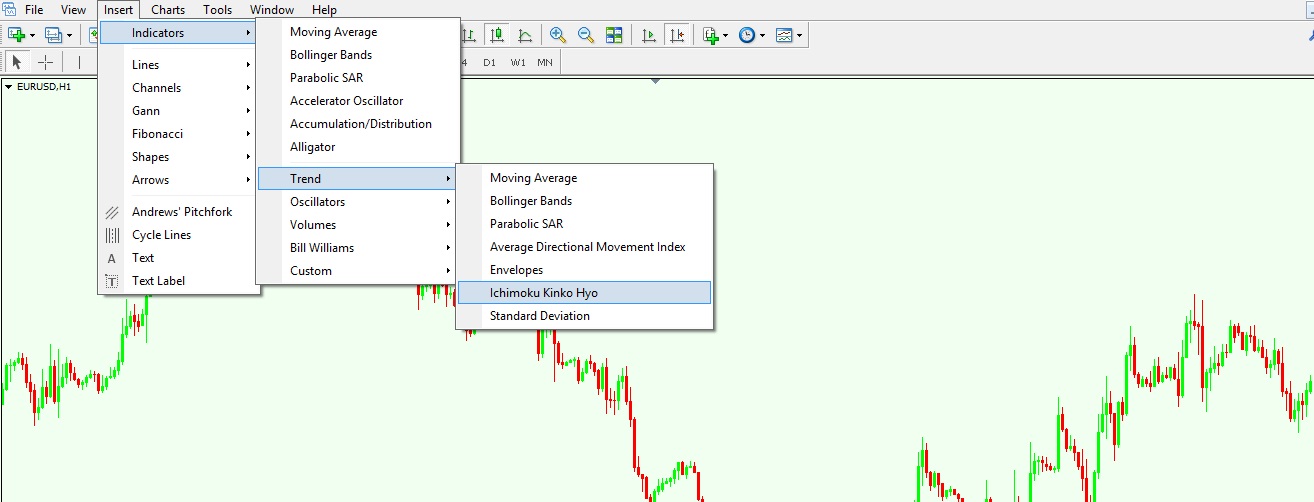
The Western approach to technical analysis was taken by surprise when Japanese Candlestick techniques that forecasted future prices were revealed for the first time. It was something so new, and at the same time so powerful, that the approach was quickly embraced by traders. We will discuss the Japanese Candlestick techniques later, as there would be no Forex Trading Academy without them. However, besides the candlesticks, the Japanese came up with something even more mysterious, yet extremely powerful: The Ichimoku Kinko Hyo system. The reason I refer to it as a “system” is due to its complexity. In reality, Forex brokers list the Ichimoku under the indicators tab. Because it is formed of multiple elements, some Forex brokers look on it as being a trend indicator, while others see it as an oscillator. For the sake of technical analysis, it doesn’t really matter as long as its interpretation is the correct one. If we consider the very definition of a trend indicator, which is an indicator that is applied on the actual chart, then this should be seen as one. The Ichimoku Kinko Hyo roughly translated means “state of equilibrium”, and the entire system formed by its elements shows exactly this: a state of equilibrium the current price has relative to both past and future projected prices. It sounds fancy and complicated, but in reality, it is not like that. Being offered together with other indicators, it is applied exactly the same: Just click on Insert/Indicators/Trend, and there the Ichimoku Kinko Hyo appears. It is worth noting here that MetaTrader 4 lists the indicator as a trend indicator.
| Broker | Bonus | More |
|---|
By selecting the indicator, a pop-up window appears, and one can set up different colours for all the elements, as well as for the periods to be used. It is recommended that the standard periods (9, 26 and 52) should be left as they are. You will see later why the 26 period especially is really important when trading with the Ichimoku indicator.
Spotting Reversals with the Ichimoku Cloud
Before looking at how we can actually spot a reversal with the Ichimoku cloud, it is time to list the elements of this complex indicator. The overall Ichimoku Kinko Hyo, or the whole state of equilibrium as mentioned above, consists of five elements: the cloud (or the “Kumo”), the Tenkan and Kinjun lines, and the Chinkou line. One may argue here that there are only four elements instead of five, but in reality the cloud is given by two averages that cross one another. These two lines are called Senkou A and Senkou B, and it is what is in between that represents the actual cloud. Hence, five elements form the whole Ichimoku Kinko Hyo system.
Defining the State of Equilibrium
Price is the cornerstone of the Ichimoku indicator, as everything is built around it. To be honest, this is what an indicator should be focused on anyway: current price, and what the future levels projected further in time would be. When compared with the current price, the cloud is projected 26 periods ahead, and shows potential support and resistance levels. Therefore, if the indicator is attached to a monthly chart, then a trader will actually see the cloud projected for the next 26 periods, or the next 26 months in this case. Moreover, the Chinkou line is projected 26 periods back in time, so, in conclusion, the current price is at an equilibrium when compared to both historical and future prices.
Spotting Reversals with the Cloud
The cloud comes in two colours that can be edited, and it is either a bullish or a bearish cloud. A bullish cloud starts forming after a bearish trend, when Senkou A crosses above Senkou B, and it is usually represented by the colour green. A bearish cloud forms after a bullish trend, when Senkou A crosses below the Senkou B line, and it is represented by the colour red. On the MetaTrader 4 platform, the colours for the cloud are different, but you probably get the overall idea about how to interpret the cloud from the description above.
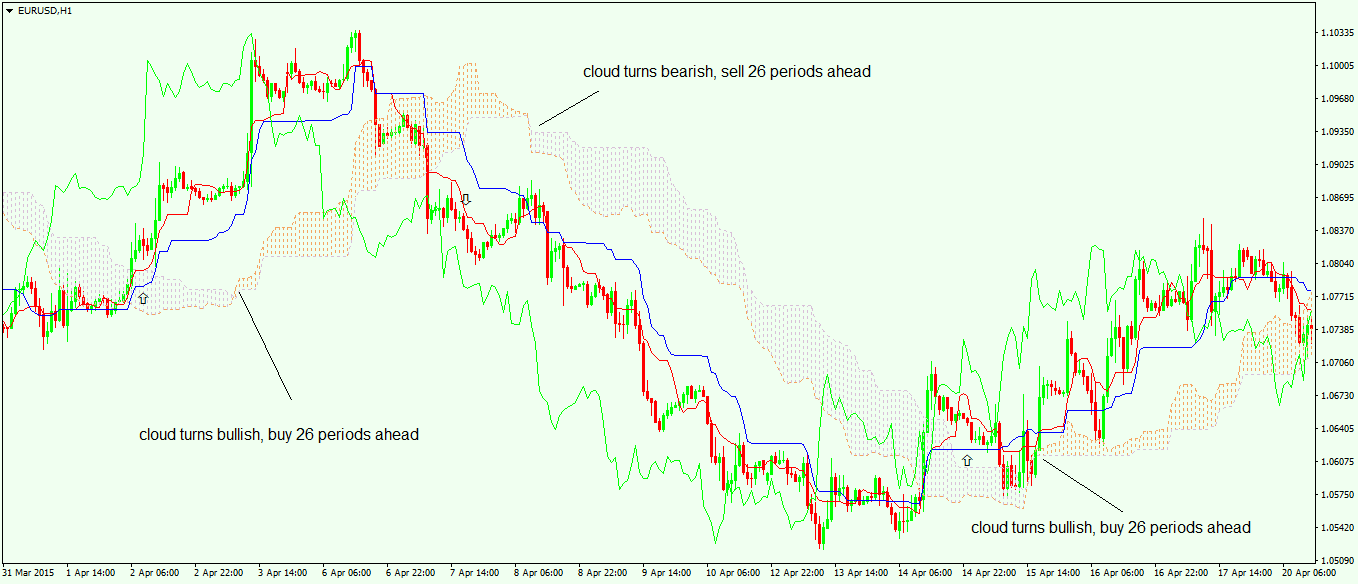
What traders do in order to spot a reversal is, of course, to look for the cloud turning during a strong trend. Therefore, in a bullish trend, if the cloud turns bearish, it is a sign that longs should be closed and we should short the market. The same is true when the cloud turns bullish after a bearish trend, as one should look to go long in that market. One thing should be kept in mind at all times: The cloud forms 26 periods ahead of the current price! We can actually see it before the price reaches there. This offers a competitive advantage ahead of the market, and it gives a trader an educated guess about the future price action, as if the cloud turns it means the previous trend is losing its strength.
Above is the EUR/USD 4-hour chart with the Ichimoku indicator attached to it. As you can see here, the red cloud is bullish and the blue one is bearish. Starting from left to right, after a bearish trend the cloud turns bullish, and 26 periods earlier one can enter on the long side. Moving forward, the cloud turns bearish, so 26 periods earlier one can short the pair all the way until the cloud turns bullish again. This is an ideal situation presented here, but overall it works very well when trying to spot reversals on the Forex market. The fact that the cloud is so visible represents a strong warning for traders, and in this way it is not possible to end up on the wrong side of the market. One should keep in mind all the time that Forex trading means reacting to ever-changing market conditions, and the Ichimoku cloud offers the possibility of knowing in advance what the future price action may bring. This is extremely important, and represents a warning that conditions will change in the next 26 periods. Ignoring the cloud signal should be done at the trader’s peril.
Other educational materials
- Overbought and Oversold Areas in Ranging Markets
- Profit from DeMarker Divergences
- Correlations Between Different Currency Pairs and Other Markets
- Leverage and Margin Requirements
- What is a Margin Call?
Recommended further readings
- Do Ichimoku Cloud Charts Work and Do They Work Better in Japan? Kai Jie Shawn L, Yanyali S, Savidge J. . International Federation of Technical Analysts Journal. 2016 Jul 9.
- Ichimoku Charts. Muranaka, K. (2000). TECHNICAL ANALYSIS OF STOCKS AND COMMODITIES-MAGAZINE EDITION-, 18(10), 22-31.


