Trading Forex with Kijun Tenkan Cross
Judging by the technical name of this article, one should already know that we’re talking about two of the Ichimoku Kinko Hyo elements: The Tenkan and Kijun lines. These two lines are represented by the colours red and blue, with the Tenkan being the red one and the Kijun the blue one. Before going ahead and reading this article in order to see how to interpret the Kijun-Tenkan cross, please refer to the other article that refers to the Ichimoku indicator here on our Forex Trading Academy project. A bearish environment is defined by the cloud being bearish, Tenkan moving below the Kijun, and price being below all three elements. The opposite is true as well: A bullish environment is defined by the cloud being bullish, the Tenkan line moving above the Kijun, and the price being above all three elements. This means that in a bullish environment, as showed by the Ichimoku, the first bearish sign that shows that the overall bullish sentiment is about to change is when the Tenkan (red line) moves below the Kijun (blue line). Such a cross represents a warning that the bullish trend is about to end, or it may simply be a fake move. More about this to be covered a bit later in this article.
| Broker | Bonus | More |
|---|
Trading the Kijun/Tenkan Cross
The Kijun/Tenkan cross is of extreme value to Forex traders, as it is highly visible and one cannot miss it. For this reason, attaching the Ichimoku indicator to a chart should ensure you are always on the alert for when the trend is going to change. The previous article dedicated to the Ichimoku indicator showed that the cloud will tell traders that conditions are about to change anyway. This is true, but there is no exact entry level, except to go back in time for 26 periods in order to find a good entry. A good entry is not a great entry, though! A great entry is to be found by correctly interpreting the Kijun/Tenkan cross.
Spotting Kijun/Tenkan Crosses on a Chart
It is very easy to spot such a cross, as these are two simple lines. In a way this cross resembles how the moving averages are crosses as well, and the golden and death crosses discussed in the moving averages article are very good examples, and similar to this one.
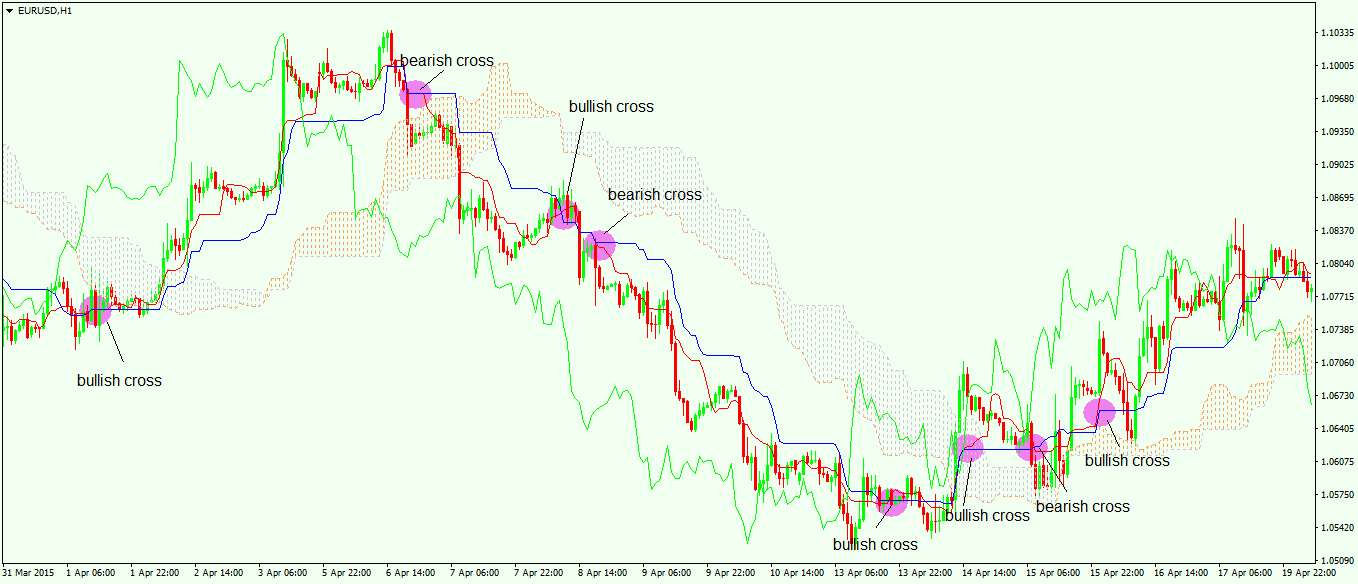
The chart below shows the EUR/USD on the 4-hour timeframe, and as you can see the price is moving all over the place, with both bullish and bearish short-term trends forming. What we’re going to discuss on this timeframe is valid for swing trading (keeping positions open for a medium-term horizon, starting from a few hours up to a few days or weeks), but the way we’re going to try to pick a trend is valid on all timeframes.
In this chart, there are no less than eight Kijun/Tenkan crosses that give the overall direction of the trend. A bullish cross calls for longs to be traded, while a bearish cross favours the taking of shorts. The idea is to go short on a bearish Kijun/Tenkan cross, and stay that way until a bullish cross forms; or to go long on a bullish Kijun/Tenkan cross and stay long until a bearish one forms. At that very moment, traders should reverse the previous trade.
Spotting Fake Crosses
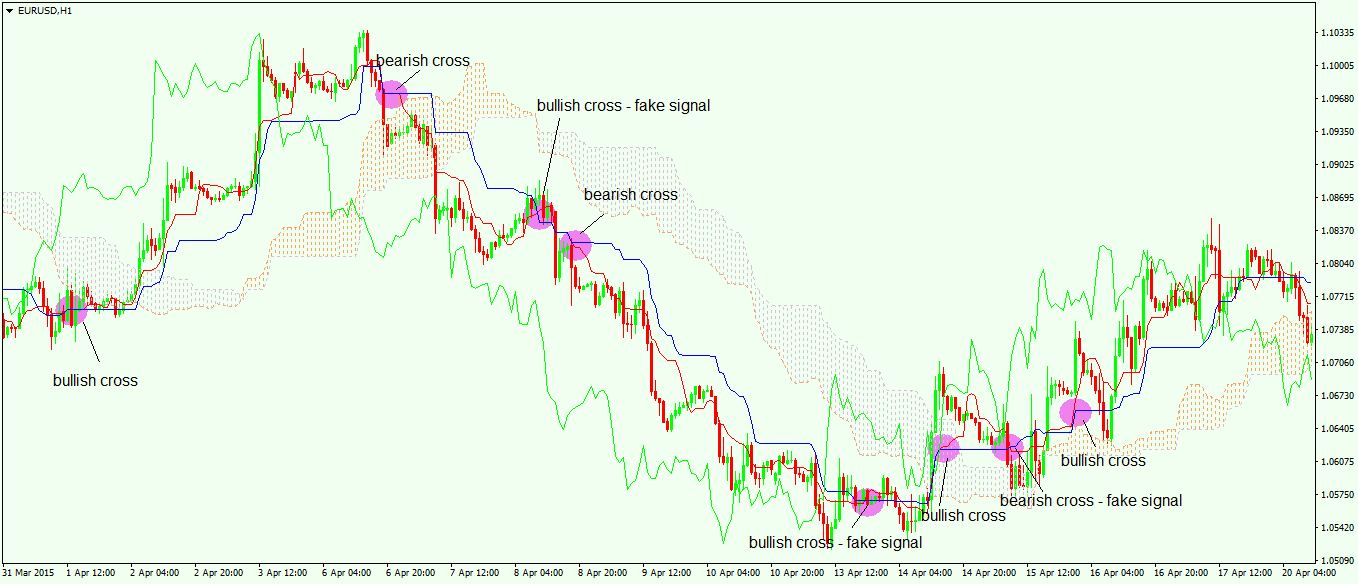
Forex trading is not that straightforward, however, as this market is best known for its fake moves and the way stops are triggered in aggressive ways. It means that not all Kijun/Tenkan crosses are valid, and some of them actually show fake signals. The risk here is to close and reverse the trades on a fake Kijun/Tenkan cross, only to see the market reversing again and the previous trend resuming. How do you avoid this kind of situation? The way to go is to use the Kijun/Tenkan crosses together with the Kumo (the cloud). For this, please refer to the previous article dedicated to trading with the cloud here on Forex Trading Academy. In other words, if a Kijun/Tenkan cross forms without the projected cloud already being turned in the direction of the cross, then the signal can be ignored and labelled as a fake one. The opposite is true as well: If the cloud has already turned before the Kijun/Tenkan cross forms, and then the cross forms, that is a solid signal, and one should take it. Fake signals are filtered in this way and, if anything, one can take another trade and add it to the original trade by the time the new cross comes after the fake one. The chart below shows how to avoid fake Kijun/Tenkan crosses.
Starting from the left side, the first bullish cross should be discounted as, if we look 26 periods (candles) to the right side, the cloud is still bearish. It doesn’t matter that the cloud will turn up bullish after that; we simply do not have that information by the time the Kijun/Tenkan cross forms. The next cross is a bearish one, and yet it needs to be discounted again as the projected cloud is still bullish. This retrospective look may give the impression that good signals are wasted, but with long-term trading it will only take the profitable trends and allow traders to spot fake swings the market may make. Considering that we’ve already had two fake crosses we shouldn’t trade, it means that the trend prior to the first cross (the bearish trend!) is still very much valid and in place. So traders should avoid that higher spike, and only stay on the short side or try to find places to sell some more.
Moving forward, we have a bullish Kijun/Tenkan cross, and this one is to be ignored, as it represents the classical fake cross. A close look at the cloud reveals a bearish cloud, and then on the next bearish cross, traders will look to sell some more. Not only did traders stay on the right side of the market from the start, ignoring the fake move higher up, but on confirmation of the trend resuming and after a fake Kijun/Tenkan cross, new trades can be taken in the same direction. You can practise with the other examples on the same chart, or simply attach the indicator to any timeframe and on any currency pair to find similar examples, and see that this approach is really powerful. Ichimoku Kinko Hyo, once again, proves to be a profitable trading tool.
Other educational materials
- How to Use Parabolic SAR to Buy Dips or Sell Spikes
- Bollinger Bands – Profit from One of the Best Trend Indicators
- Trading with the Cloud – Use Ichimoku Cloud to Spot Reversals
- Forex Market Terminology
- Profit from Forex Trading Using Different Trading Styles
- How to Set Up an Expert Advisor
Recommended further readings
- DEFINITION of ‘Tenkan-Sen’ Investopedia.com
- HOW TO TRADE: Ichimoku – Tenkan Sen And Kijun Sen MQL5.com


