Tom DeMarker is one of the most famous contributors to the technical analysis field, and over time he has developed many indicators that bear his name. This one, the DeMarker indicator, is an oscillator that is offered for free to any trader who uses the MetaTrader4 platform. Other trading platforms also incorporate the DeMarker, and even some other indicators such as the DeMarker Sequential. However, these two are pretty much the only ones that can be found for free and can be used in analysing markets. It doesn’t mean that the ones you have to pay for are better and will show you exact entry and exit levels. This is not the case because, as mentioned in other articles here on Forex Trading Academy, there is no holy grail in trading when it comes to technical set-ups. Some indicators may be more accurate and work better under specific circumstances, while others give best results in different environments. The DeMarker indicator fits into the oscillators category, and it is therefore applied on the bottom of a chart. The same location as for any other oscillator is used this time as well: Insert/Indicators/Oscillators.

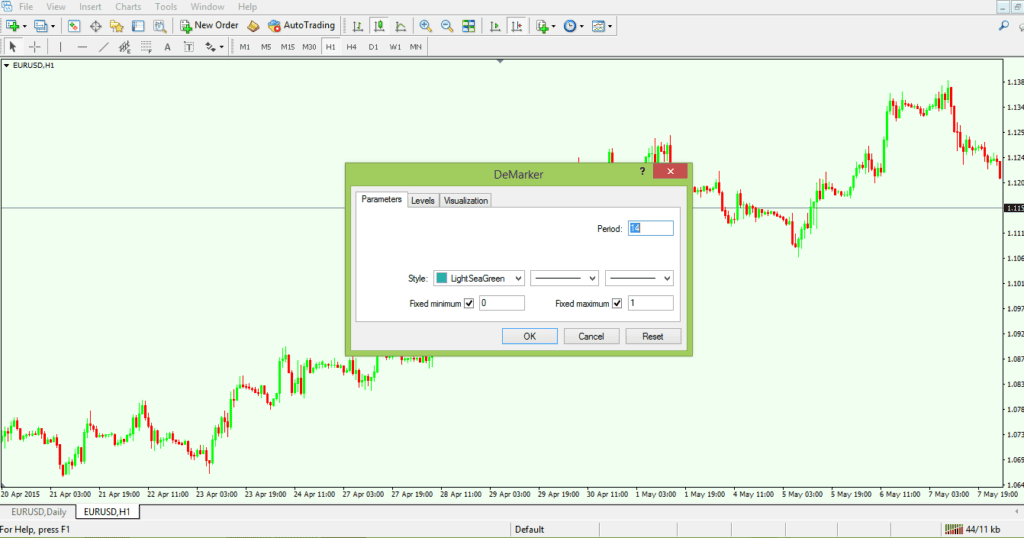
On clicking the DeMarker tab, a pop-up window appears, giving the trader the possibility of choosing the parameters to be used and the colour and overall set-up for this indicator. The usual caveat applies here as well: The longer the period chosen, the more the indicator will flatten.
It is recommended to use the 14 periods, the default option, but a trader can actually pick any other period he/she considers suitable for achieving best results.
How to Use DeMarker Divergences
Before talking about divergences with this oscillator, we need to look a bit at its structure. The DeMarker travels only in positive territory, between the 0 and 1 level, and it is considered in many ways to be similar to the Relative Strength Index (RSI). The reason for this stems from the fact that the 0.3 and 0.7 levels are considered to be oversold and overbought levels, respectively. However, there’s a catch: As you’re going to find out when we talk about the RSI later, on the DeMarker, the oscillator can stretch easily to values close to zero or 1. It is not the same for the RSI, where these levels are difficult to reach. There are two ways to use DeMarker divergences: One is the classical way, namely to look for a bullish or bearish divergence forming in the overbought and oversold areas (above 0.7 and below 0.3); and the other one is to bring into the equation the 0.5 level.
Classical Divergences with DeMarker
The classical way to use the DeMarker oscillator is to simply to look for bullish and bearish divergences that are forming within overbought and oversold areas. These divergences are easy to spot and identify, and are extremely reliable. However, there’s one thing to consider: Divergences in overbought and oversold areas work very well in ranging markets. Otherwise, it may be that the market stays in those areas for quite some time before reversing, if ever. Make sure you refer to our article dedicated to overbought and oversold areas.
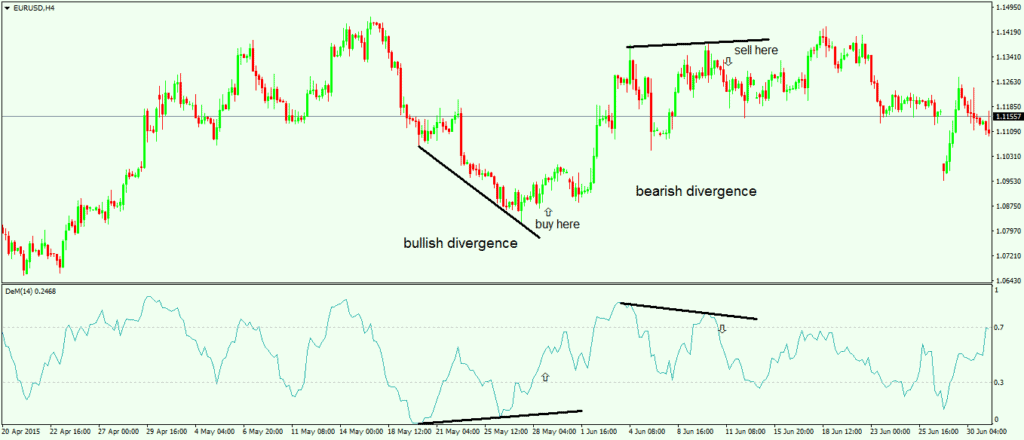
The chart above shows the DeMarker being attached to the EUR/USD 4 hours timeframe, and a classical bullish divergence can be spotted. In such a divergence, the price makes two consecutive lower lows, while the oscillator does not confirm the second low. The place to go long in this instance is after the oscillator moves back above the 0.3 level (so technically the market is not in the oversold level anymore) and the exit level should be after the DeMarker breaks the overbought level and dips below the 0.7. Immediately after the bullish divergence, the price actually forms a bearish one, only this time things are interpreted exactly the other way around. A bearish divergence calls for the price to make consecutive higher highs, while the oscillator does not confirm the second high. Therefore, the thing is to go short on such a divergence, using the same logic as with the one mentioned above. Again, all these are valid when markets are in a ranging environment, but not a trending one.
Using the 0.5 Level with the DeMarker Oscillator
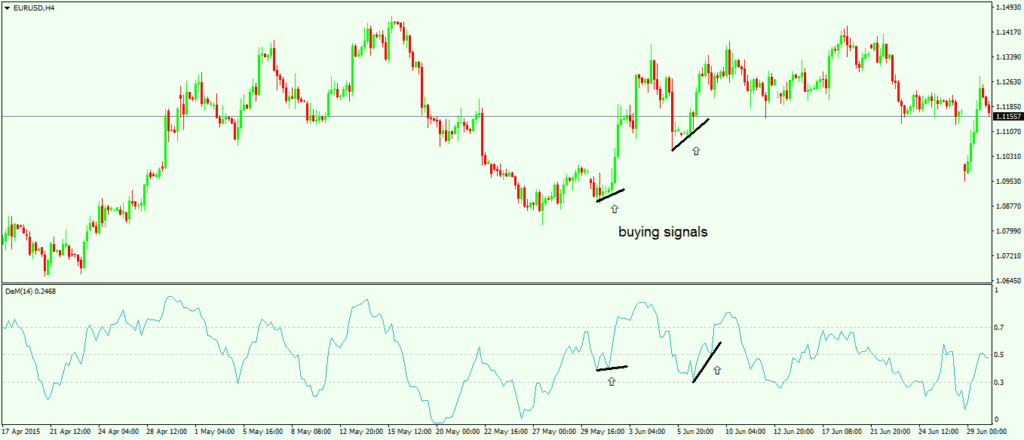
Another way to use the DeMarker oscillator is to use the 0.5 level as the key for taking a trade. While on a classical divergence we should look for the price and oscillator to show different moves on the second swing, this time we should look for the price and oscillator to make identical swings. The only thing that needs to be considered is that prior to these swings, the oscillator needs to break into the overbought territory (or above the 0.7 level), or into the oversold territory (or below the 0.3 level). In the first instance, one should look to buy on a dip below the 0.5 level when two swings with the DeMarker appear, or sell on a spike above 0.5 when two swings with the DeMarker appear as well.
The chart above illustrates the 0.5 set-up and how the swings should be interpreted. While the first buying signal should be considered a risky one, aggressive traders may take it even though the price did not break above the 0.7 level first. The second signal illustrates this theory perfectly, as the oscillator dips below the 0.5 level after breaking the 0.7 first. A bearish scenario will call for a prior move below 0.3, and for the oscillator to spike above 0.5 while not breaking the 0.7 level. To add a new level on an indicator, simply right-click on the screen, and from the Indicator List chose the indicator to edit. Under the Levels tab, any level can be added. DeMarker is just another oscillator to be used to filter the moves the market is making; and it should be considered that in some ways the signals offered by DeMarker are more accurate than the ones offered by the Relative Strength Index (RSI). I tend to disagree with this statement, but you’ll find out more about the RSI in the next article here on Forex Trading Academy.
Other educational materials
- Correlations Between Different Currency Pairs and Other Markets
- Three Ways to Trade Forex with CCI (Commodity Channel Index)
- Overbought and Oversold Areas in Ranging Markets
- Bollinger Bands – Profit from One of the Best Trend Indicators
- Trading with the Cloud – Use Ichimoku Cloud to Spot Reversals
- Trading Forex with the Kijun/Tenkan Cross
Recommended further readings
- “Heuristic based trading system on Forex data using technical indicator rules.” Ozturk, Murat, Ismail Hakki Toroslu, and Guven Fidan. Applied Soft Computing 43 (2016): 170-186.
- STOCK FORECASTERS. CHEEMA, A., VORA, A., JAIN, C., KATARIA, P., SHAH, R. and WAGH, S., 2008.
Related Articles