After the Relative Strength Index (RSI), the Stochastic indicator is widely used by Forex traders in order to identify tops or bottoms a market may make. The indicator falls into the oscillators category and, as a consequence, it is applied below the actual price chart.
The overall idea of trading with the Stochastic oscillator is to find out tops or bottoms, and these form mostly in overbought and oversold territories. Nothing new so far when compared with other oscillators. But what makes the Stochastic oscillator a special one is the fact that it is not composed of one single line, as is the case in the DeMarker and Relative Strength Index oscillators, but of two lines. These two lines, in a way, act the way two moving averages act, with one crossing below or above another by the time the market is about to turn.
This is why the Stochastic oscillator is so popular: The signals generated are visible, and clear to understand and trade. There is a saying that “Simple things work best,” and in this case, this is very much true.
Does this oscillator work 100% of the time? The answer is no, but it is impossible to miss when the market turns if you use it properly.
How to Trade with Stochastic
The Stochastic oscillator is to be found on the MetaTrader 4 trading platform under the Insert tab, Indicators, Oscillators. As you can see from the list below, of all the oscillators offered with the default MetaTrader 4 settings, this one is right at the bottom of the list.
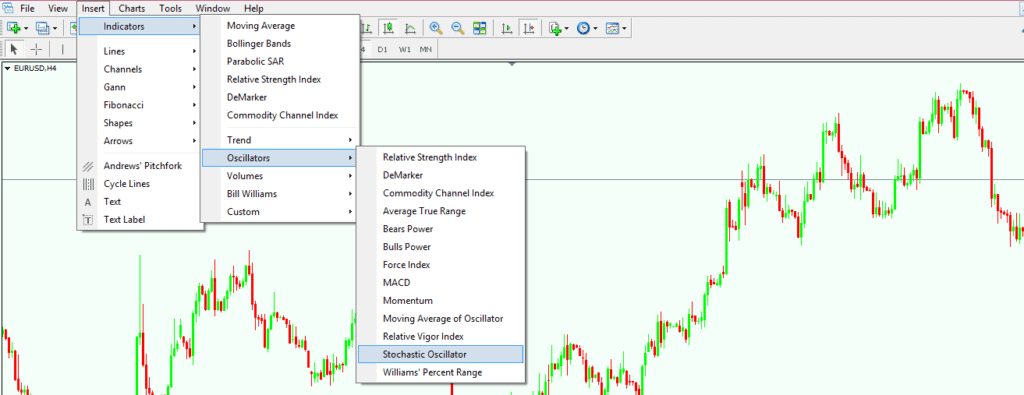
This doesn’t make it any less important, though; it is just the way the oscillators are arranged. Nevertheless, if that list is telling us something about the importance of the indicators in this category, then the RSI tops it, and this tells much about its popularity.
Coming back to the Stochastic oscillator, if selected from the above-mentioned list, a new pop-up window will appear, and we can choose the parameters we want to edit (if any) or change the values that define the oscillator. The most important values out of the three seen below are the %K and %D ones.
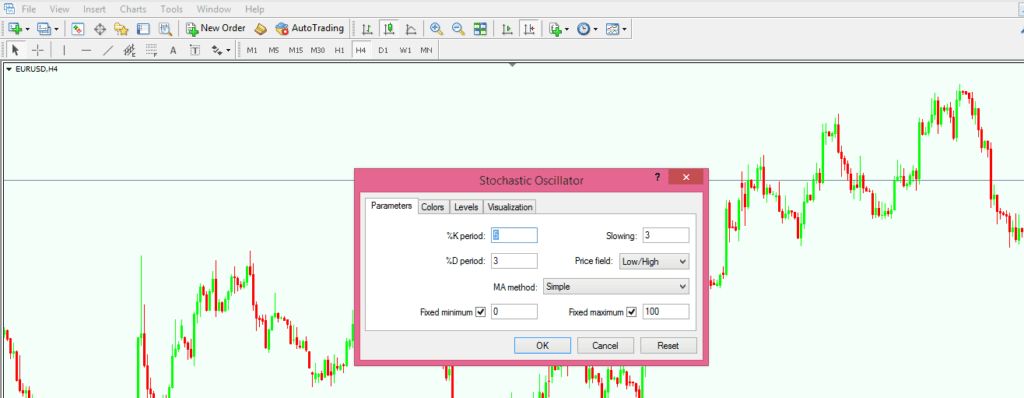
Under the default settings, they come with values of 5 and 3 respectively. The %D referred to as the “fast Stochastic”, while the %K is the “slow Stochastic”. This is what gives the two lines of the oscillator, and when the fast Stochastic crosses below the slow one, the market is turning bearish, while a bullish cross is forming when the fast Stochastic moves above the slow one.
If you click the OK button on the chart above, the oscillator is plotted on the screen. The two lines are represented in different colours, in order to differentiate between the slow and fast Stochastics and to quickly see the crossing of the two lines.
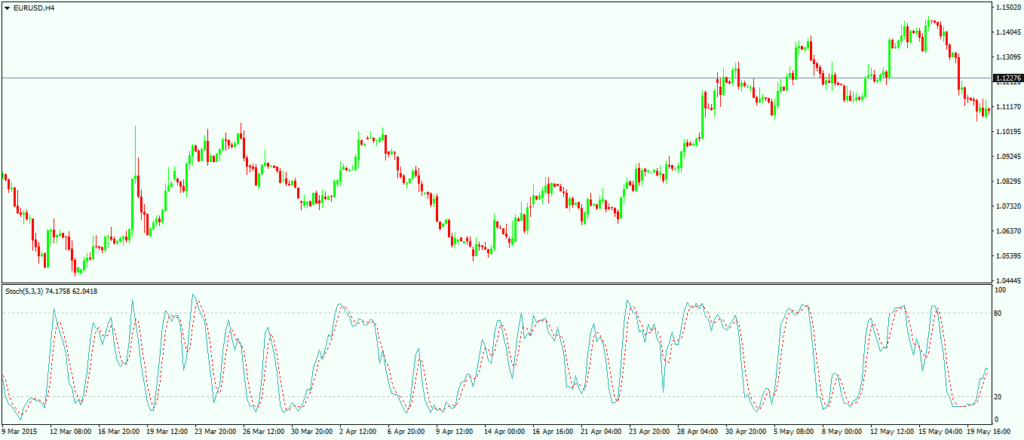
Stochastic travels between 0 and 100, and any value below 20 is considered to be oversold, while any value above 80 is considered to be overbought. One thing that should be taken into account here is that this oscillator is travelling when the market is in a consolidation as well. For example, in Asian sessions, when the market is mostly consolidating, the Stochastic will still travel between overbought and oversold levels, or the other way around.
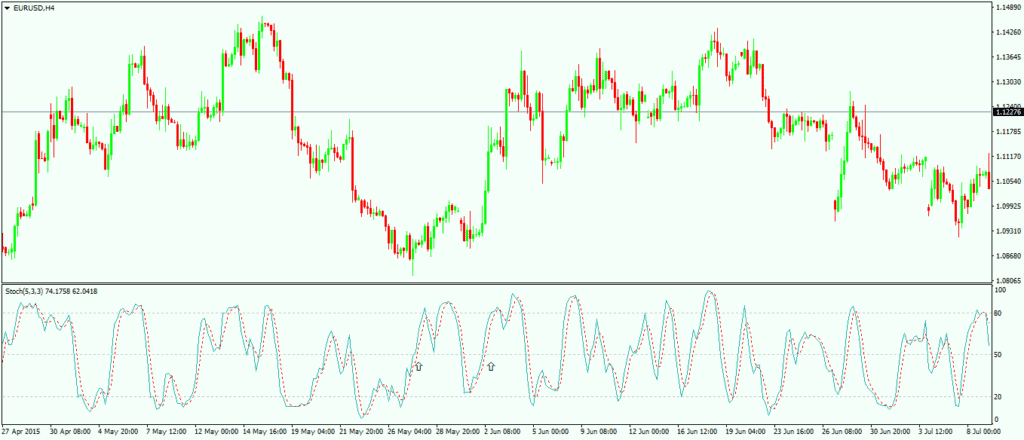
Trade Crosses Above 80 and Below 20
It goes without saying that the standard interpretation is to look for the fast Stochastic line crossing below the slow one in an overbought or oversold level. That is, look for the cross to form above 80 or below 20 before actually entering the market.
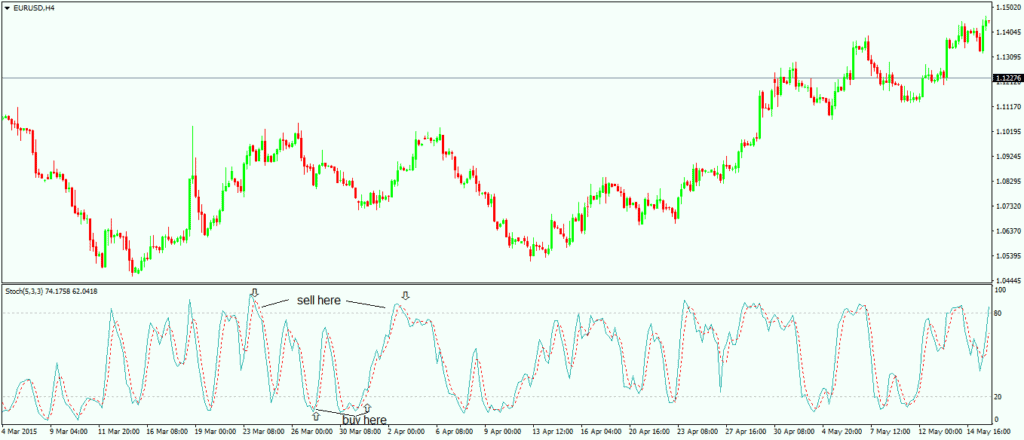
A classical entry would look like the ones above, with the crosses happening above the 80 and below the 20 levels. The other crosses should be ignored. As you can see above, there are some other crosses that happen in between those levels, and even beyond them, but without a market to turn. How do we make sure we’re not caught in a wrong trade due to a fake signal?
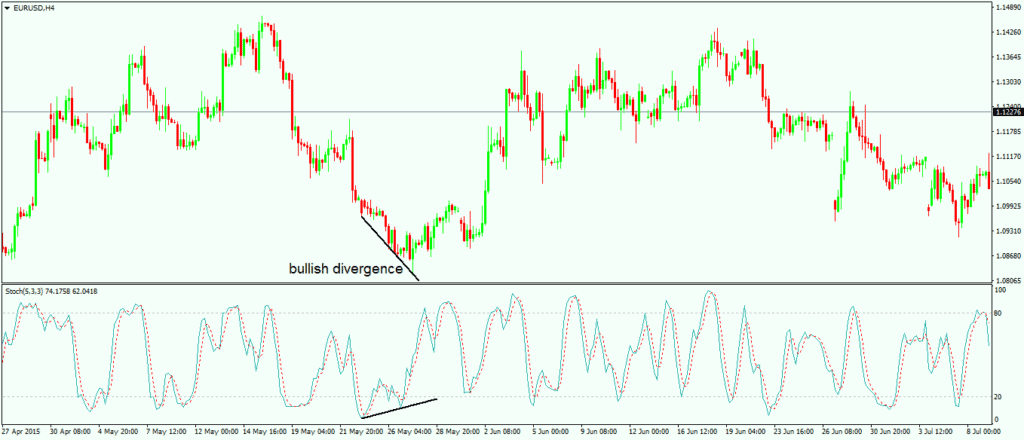
Trade Divergences Between Price and Stochastic
In order to avoid a fake signal, divergences can be used. These divergences act in the same way as we mentioned here on our Forex Trading Academy when we discussed the Relative Strength Index (RSI) and the DeMarker oscillators.
The example below shows a bullish divergence that happens when the oscillator is not confirming the way the price is moving and traders are going long by the time the second bullish cross in the Stochastic is forming. As a take profit, this can vary based on the strategy used, and one of the most popular practices is to trail the stop on any good entry.
Using Stochastic as a Continuation Pattern
This oscillator can also be used as a continuation pattern, and in order to do that we simply need to add a new level. Because the 80 and 20 are already overbought and oversold levels, the 50 level comes in handy, as it is right in the middle of the range.
Adding the 50 level, or any other level as a matter of fact, is quite a simple thing to do: Simply right-click anywhere on the chart, and under the Indicators list, the Stochastic can be edited.
The pop-up window under the Levels tab allows you to add any level you want, and to change its structure, colour, visibility, etc., in such a way that it is showing what it is intended to show. The Stochastic oscillator with the 50 level added should look like the chart below.
The idea is to buy a cross of the 50 level after Stochastic turns from the overbought or oversold level, and to hold it until a signal in the opposite direction appears. While it does not work 100% of the time, it gives a great incentive for riding a trend that otherwise might be missed.
Using the three methods described in this article will give great results if all the signals are taken. In this way, an account will end up being hedged at one moment in time, but in time all the trades will end up being closed.
The usual caveat applies here as well: The longer the timeframe the Stochastic oscillator is applied to, the more powerful the implications are. To trade all those strategies on a longer timeframe, though, requires a bigger trading account.
Other educational materials
- How to Use Parabolic SAR to Buy Dips or Sell Spikes
- Finding Entry and Exit Levels with Momentum Oscillator
- Trade Forex with Volumes Indicator
- Bill Williams – How to Use Williams Indicators When Trading Forex
- How Do I Make a Profit from Forex Trading?
- Forex Market Terminology
Recommended further readings
- Derivatives in Financial Markets with Stochastic Volatility Jean-Pierre Fouque, George Papanicolaou, K. Ronnie Sircar, Cambridge University Press, 3.07.2000
- Notes on Stochastic Finance Nanyang Technological University


