The Relative Strength Index (RSI) is the most famous oscillator of them all. There is virtually no trader, whether a Forex trader or any other kind of trader in this world, who hasn’t heard about the RSI and its use in trading financial products. So many theories have been written based on how the RSI works, and so many other oscillators have been built based on its structure, that out of all the oscillators to be found, most of them show the same thing as the RSI.
Therefore, whenever taking your entries and exits based on an oscillator, consider that it is like trading with the RSI. After all, all oscillators show the same thing: buying or selling in oversold or overbought areas.
The Relative Strength Index is an oscillator, and therefore will appear at the bottom of the chart it is attached to. To apply the RSI to any chart, just select the currency pair you want to attach the RSI to, and the timeframe, and then simply go on the Insert/Indicators/Oscillators tab and choose the RSI. This is valid for MetaTrader 4, as our whole Forex Trading Academy project is based on this trading platform.
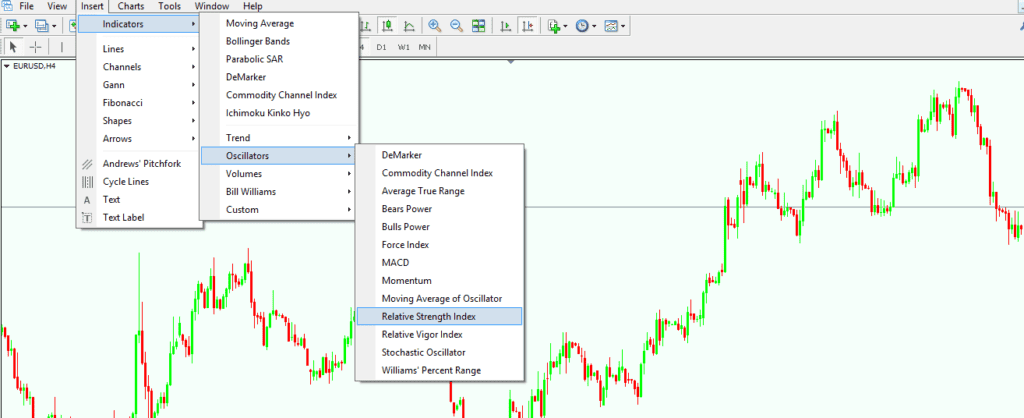
From the oscillators list you can see on the chart above, we’ve discussed a few here on our project, but keep in mind one thing: There is none more important than the RSI. If a trader understands how the RSI travels and how to interpret it, then simply applying the same principle to other oscillators will have the same result.
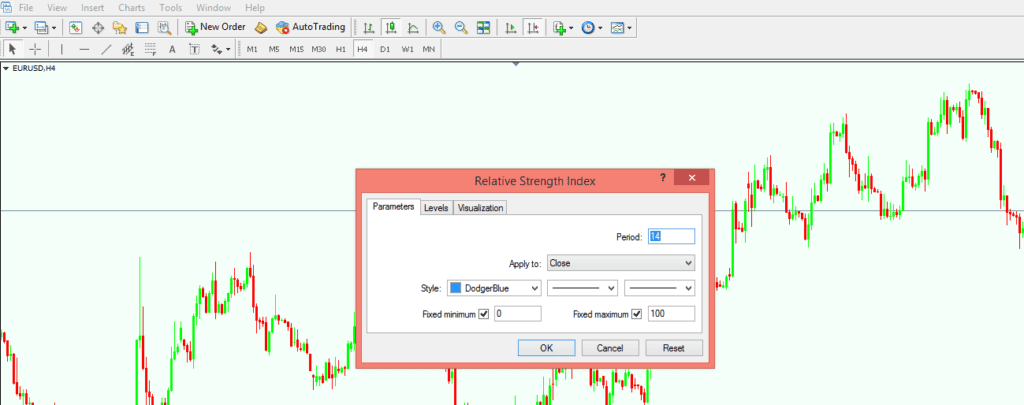
By selecting the oscillator from the image above, a pop-up window in the middle of the screen appears, and traders can choose the set-ups they want for the RSI, such as the colour and size of the line, and the period the oscillator will take into account; and one can even modify the levels the RSI will travel between. This can be done for any oscillator, so nothing new so far.
It is recommended to keep to the 14 periods, the default one, as if the period is increased, the RSI line will flatten, while if the RSI period is decreased, the oscillator swings will be more aggressive and interpretation will be difficult. This doesn’t mean that the trader cannot play with the levels and the period in any way he/she wants, of course.
Ways to Trade with the RSI
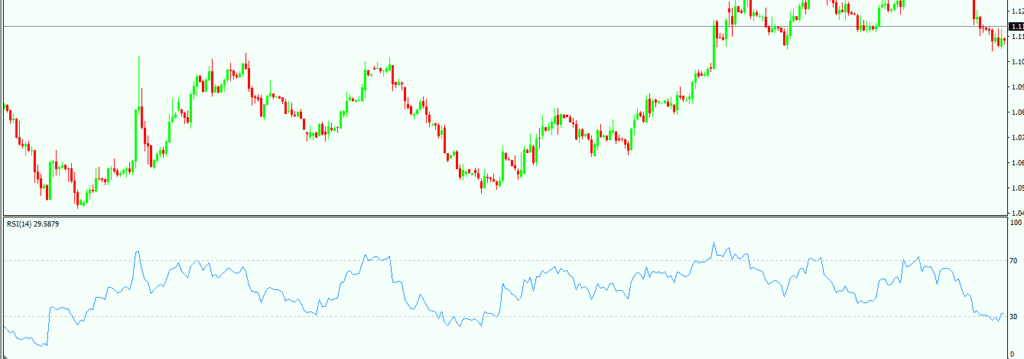
Before moving on to how to actually trade with the Relative Strength Index, one needs to understand what the oscillator shows, and what its standard interpretation is. The image below shows the oscillator applied on the 4-hour EUR/USD chart, and using the default settings offered by the broker, the 30 and 70 levels are predefined.
These are the levels where price is considered to be overbought (above 70) and oversold (below 30). If you refer to the DeMarker indicator presented here on our Forex Trading Academy project, you’ll see that the similarities are remarkable, as DeMarker uses the 0.3 and 0.7 levels to define overbought and oversold areas.
On the same line, the RSI travels between zero and 100, and it is impossible at any one time to have negative values, or values above the 100 level. No matter how aggressive a move may be, those levels cannot be broken.
The following are three ways to trade using the RSI oscillator, and all of them are important for a trader, based on the trading style and the timeframe the oscillator is applied to. There’s no one approach that is more effective than any other; there’s only one trader who pays more attention to detail than any others.
Trading Bullish and Bearish Divergences with the RSI
The classical interpretation of the RSI oscillator is, as mentioned multiple times in this article, to sell in overbought areas and buy in oversold areas. This is valid for all oscillators, and I’m not going to persist anymore on this subject. This now works 100% of the time though, as when the market breaks out of an important consolidation area, or when a surprising economic news item is released, these areas are the ones where price is accelerating, not slowing down. These are the areas where market participants are getting caught on the wrong side of the market, and where margin calls are being triggered.
To avoid such a thing and to bring in a little help from the technical analysis field, divergences between price and oscillator can be used. Divergences can be either bullish or bearish, and traders look for them to form in these areas. A divergence forms when the price makes two highs/lows, for example, and the oscillator does not confirm the second high. Ideally, for the signal to be strong, at least one of the two highs/lows should appear in the overbought/oversold area.
A bullish divergence will have a bearish trendline on the actual price chart and a rising one in the oscillator window. The opposite is true for a bearish divergence, with a rising trendline in the oscillator chart window, and a falling one on the actual price chart.
I’m not going to give examples of divergences with the RSI here, as they are simply similar to the ones described in the article dedicated to the DeMarker oscillator here on the Forex Trading Academy. The purpose here is not to repeat things, but to explain them in such a way that they are properly understood.
Use the 50 Level as a Continuation Pattern
Another way to trade Forex with the RSI oscillator is to actually use the 50 level as a continuation pattern. This means that if the oscillator is falling from the overbought area, by the time it crosses the 50 level it should be a continuation signal for more downside.
The opposite is true as well, with the 50 level being a nice place to go long when the oscillator travels from the oversold area and breaks the 50 level to the upside. In order to see that on the actual oscillator window, the indicator needs to be edited and the 50 level added. To do that, just right-click anywhere on the chart, select the RSI from the Indicators list, and under the Levels tab, you can enter the desired value.
These are just a few examples of how to actually use the RSI oscillator when trading, but one should keep in mind that there are numerous trading techniques based on it. After all, there is no other oscillator so popular and famous as the RSI, so it is no wonder traders use it so much in their research.
Other educational materials
- Using Stochastics to Trade Forex Markets
- Finding Entry and Exit Levels with Momentum Oscillator
- Trade Forex with Volumes Indicator
- Bill Williams – How to Use Williams Indicators When Trading Forex
- How Do I Make a Profit from Forex Trading?
- Forex Market Terminology
Recommended further readings
- Forex forecasting The Wharton School, University of Pennsylvania
- An Automated Trading System with Multi-indicator Fusion Based on D-S Evidence Theory in Forex Market Zhihong Liu, Deyun Xiao, 14-16 Aug. 2009


