The Momentum oscillator is highly regarded for the accuracy of the signals provided, and it is one indicator that incorporates the most important thing in trading: price action. Price action tells much about the future direction of the market, and the Momentum oscillator is the ideal tool to use.
Such an oscillator is to be found on the same Insert/Indicators/Oscillators tabs on the MetaTrader 4 trading platform as any other oscillator, but its interpretation is a bit different. In a way, it resembles all oscillators, as divergences can be traded as well, but in some other ways, it looks more like the CCI (Commodity Channel Index).
Momentum has only positive levels and, while not on the standard settings, the 100 level is key for correct interpretation of it. Everything should be related to the 100 level, starting with the overbought and oversold levels and ending with divergences the market will make.
Applying the oscillator on a chart is fairly easy, and by now you should know how to do this as we’ve covered this part many times in our Forex Trading Academy. Despite the fact that it is considered a second-tier indicator, compared to the more powerful Relative Strength Index (RSI), DeMarker, and the Commodity Channel Index (CCI), it is one of the most accurate when it comes to the actual levels to enter and exit a market.

The only thing that a trader needs to know is how to correctly interpret it and how to use it. In the image below we can see that the default period given by the MetaTrader4 platform is 14, and this means the oscillator is taking into account the previous 14 candles in order to plot one value.

By clicking OK, the Momentum oscillator will be applied on a chart, at the bottom of the actual chart, showing a blue line that hovers around the 100 level. However, this level is not there, and in order to add it, we need to edit the oscillator.

This is done fairly simply, as a level can be added by choosing the Indicators List (after right-clicking on the screen) and the Momentum oscillator from that list. Any level can be added, but 100 is the obvious one in this case.

On the bottom right side of the image above you can see that the upper value of the Momentum oscillator in this example is 104, and the lower value is approximately at the 96 level. It is therefore only normal to interpret it based on the 100 level, as this is the level that makes the difference between a bullish and a bearish market.

Above it is the Momentum oscillator with the 100 level, and again, anything above that level means that the market is in a bullish stance (hence price action is bullish and will find support on dips), while values below the 100 mean a bearish market is in place, and price action will be extremely negative.
So far, we have showed here how to apply and to edit the Momentum oscillator according to our needs. But how do we actually trade it?
Ways to Trade with Momentum Oscillator
There are many ways to trade with the Momentum oscillator, and the most important ones are listed below. As you probably noticed already, the default settings are not really helping here, and we need to edit the indicator in order for any kind of analysis to make sense. This will be even more obvious in the examples below.
Using Bullish or Bearish Divergences
By now, we all know how to spot a bullish or a bearish divergence: The price makes two higher highs or lower lows consecutively, while the oscillator does not confirm the second spike/dip. This is something that every trader should know.
What is interesting in the case of the Momentum oscillator is the fact that, as mentioned at the start of this article, it represents price action in its pure form. It means that divergences are more accurate using this oscillator when compared with other ones, RSI included.
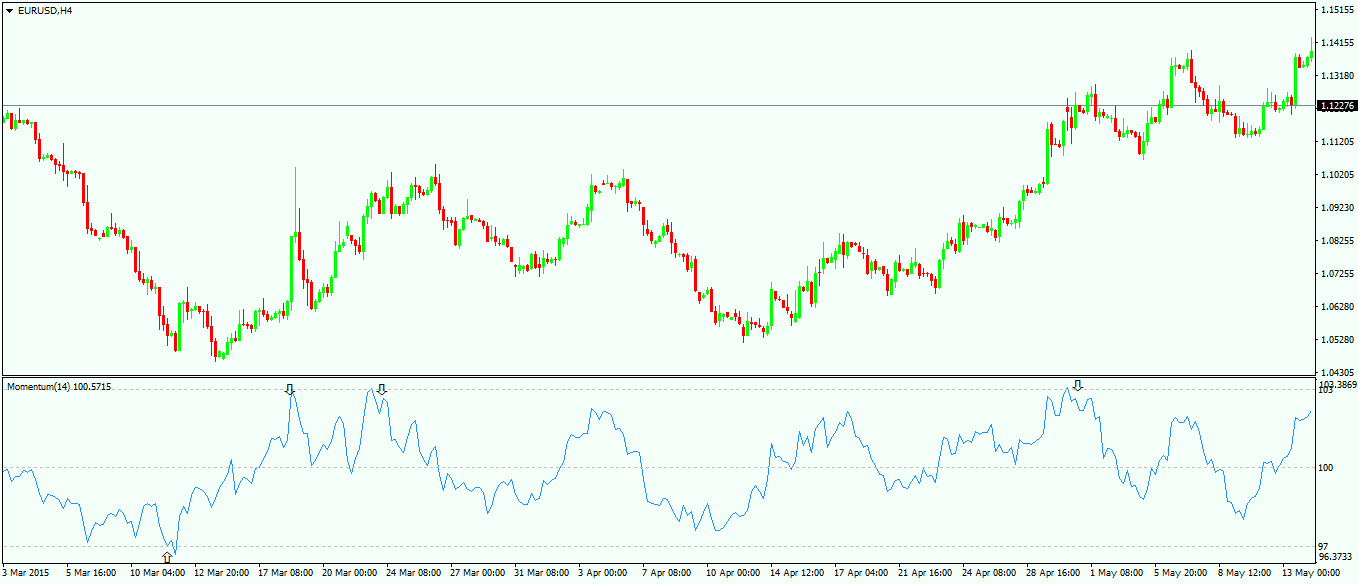
The chart above shows no less than three accurate divergences forming one after the other, and this tells much about the power of divergences with the Momentum oscillator. Price action is defining here, and it is the reason for these accurate signals.
Trading Overbought and Oversold Levels
While other oscillators had the overbought and oversold levels implicitly given by the MetaTrader 4 platform, this is not the case with the Momentum here, as one needs to clearly define those areas. To do this, a quick look at the historical levels of the oscillator should offer us a clear guide for finding them.

Using the example above, and considering the highest level of the Momentum oscillator for the time being the 104 level, and the lowest one the 96 level, we can add two horizontal lines to define overbought and oversold areas. The chart above shows the oscillator being modified, with the 103 as the overbought level and 97 as the oversold one.
The idea is to trade on the short side every time the oscillator goes in the overbought level (in our case above 103) and to stay short until the 100 (the all-important 100 level) is reached. For a long trade, we need to wait for the oscillator to go into the oversold territory before buying, and the take profit should be at the 100 level as well.
One thing needs to be mandatorily mentioned here: Traders need to wait for the candle to close into the overbought or oversold territory. Otherwise, it is possible for the oscillator to travel into those areas, but to retrace before the candles are closing. This would not be valid as a signal. If the timeframe is a long one, such the daily or even longer, it is even more important to wait for the actual close of the candle, as otherwise there is the possibility of being trapped on the wrong side of the market. When this happens on such a long timeframe, it usually affects the trading account in an important way.
With the Momentum oscillator, we’ve covered by now all the important ones, each and every one of them having its own way of being interpreted. While the methods to trade them seem to be similar, I can assure you that the signals are not. In order to check that, just do a simple exercise: Plot all the oscillators covered here on a chart, and look for places to go long or short as described in the articles here on our Forex Trading Academy. This is the only way to understand the power of trading with oscillators, as the result is that you’ll end up always trading on the right side of the market.
Other educational materials
- How to Use Parabolic SAR to Buy Dips or Sell Spikes
- Moving Averages – Find Support and Resistance Areas
- Trade Forex with Volumes Indicator
- Bill Williams – How to Use Williams Indicators When Trading Forex
- How Do I Make a Profit from Forex Trading?
- Forex Market Terminology
Recommended further readings
- Financial Stock Market Forecast using Data Mining Techniques K. Senthamarai Kannan, P. Sailapathi Sekar, M.Mohamed Sathik and P. Arumugam, Hong Kong 2010
- Technical Analysis University of Cambridge
Related Articles