
- AUD/USD rolls over
- Breaks bottom of hammer
- Larger rectangle
The Australian dollar has struggled during the trading session on Thursday, as the market has broken down below the bottom of the range of the previous session. The market has been negative for quite some time, and the recent action suggests that we are about to see more of the same. After all, the 0.69 level continues to offer resistance, an area that had offered support. Previously, the market had rallied to this area and then broke down.
Australia has a special place in the forex world as it is highly sensitive to the Chinese economy
The Australian dollar is highly sensitive to the US-China trade situation, which is in a state of limbo at the moment. At this point in time, the market should continue to favor selling the Australian dollar until we get some type of resolution to the trade war. Remember, Australia has a special place in the forex world as it is highly sensitive to the Chinese economy due to Australia exporting so many commodities to the construction and manufacturing sector.
Technical analysis
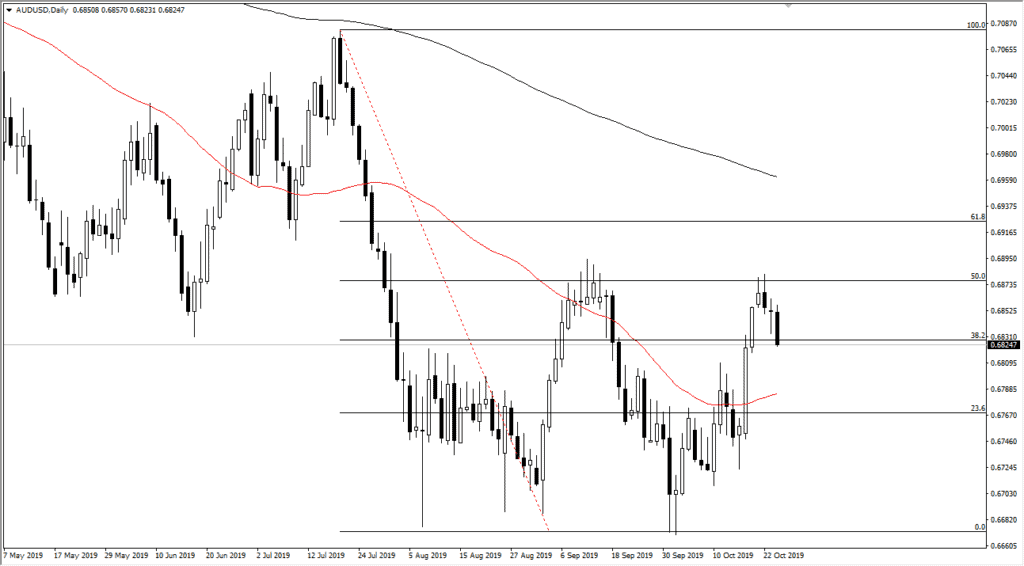
AUD/USD chart
The Australian dollar has broken below the hammer from the previous session, essentially making it a “hanging man”, which is a very negative sign. Ultimately, the market is probably going to go looking towards a 50-day EMA underneath, and then eventually the 0.67 level, which is the low.
This is a market that should continue to see a lot of choppiness, but given enough time, we will eventually have to come to some conclusion when it comes to the trend.
For now, though, it’s obvious that the 50% Fibonacci retracement level has offered resistance, as it has in the past. Ultimately, if the market was to break down to a fresh, new low, then it would open up the possibility of a move to the 0.65 handle.
To the upside, if the market were to break above the 50% Fibonacci retracement level, then the 61.8% Fibonacci retracement level would be targeted next. After that, the 200-day EMA should offer significant resistance. If the 200-day EMA were to be broken, then you could start to talk about a longer-term trend change. Right now, though, it has and will continue to be thought of as a massive barrier. Fading short-term rallies continue to work on this chart, especially when looked at through the prism of a multi-day chart. Ultimately, this is a market that could be building a base, but it needs some type of external influence from the US-China trade negotiations.
Beyond that, there are also concerns about the global growth situation, which is going to weigh upon the Chinese economy regardless. The US dollar has been given a bit of a boost due to the treasury markets until recently, so paying attention to what happens in the bond market is probably a good way to monitor US dollar strength. Ultimately, in the short term, it looks as if we are ready to continue more of the same, giving us an opportunity to sell the Aussie dollar.


