British Pound Forming Flag Against Japanese Yen

- Major flag forming daily chart
- Sitting just above 200-day EMA
- “Risk-on” market
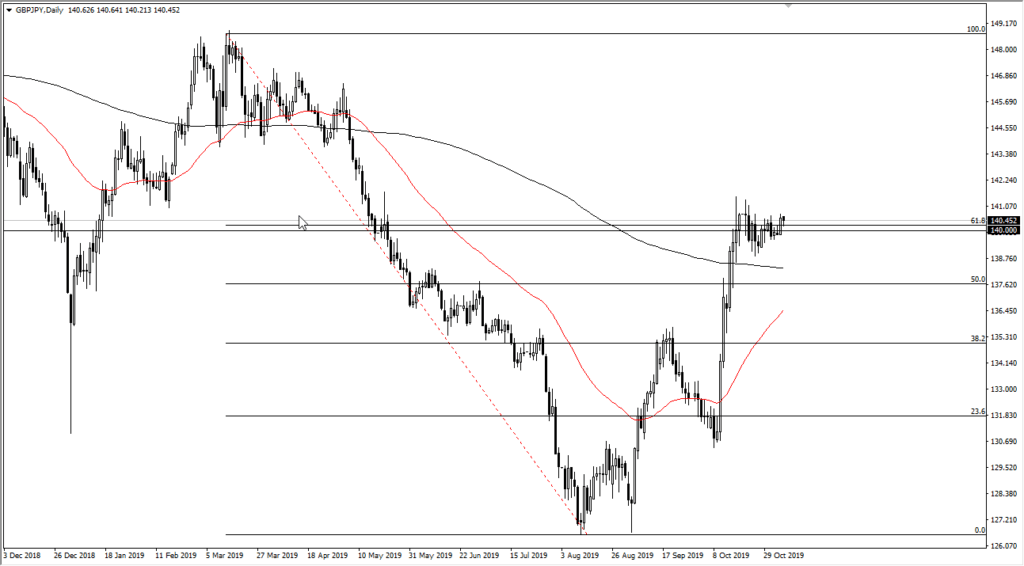
The British pound has pulled back slightly to kick off the trading session on Wednesday, as the market has danced around the psychologically and structurally important ¥140 level. This is an area that will attract a certain amount of attention just based on the fact that it is a large, round, whole number. Over the last couple of weeks, the market has been digesting gains and is sitting in a very tight range.
Technical pattern

USD/JPY chart
The technical pattern for the GBP/JPY pair is that it is forming a large bullish flag. Bullish flags attract a lot of attention because they become so obvious over time. What is particularly interesting about this one is that it is measuring a move towards the ¥150 level, given enough time, as the “pole of the flag” is roughly 1000 pips.
The 200-day EMA sitting just below the bottom of the flag is also a very bullish sign, as it should attract quite a bit of attention. The 200-day EMA will quite often attract longer-term traders, and they will simply buy or sell based on which side of that moving average the market is on. It also is used as a major filter based on longer-term trading systems. In other words, it carries a lot of weight in directionality.
Brexit and risk appetite
The Brexit situation continues to be somewhat fluid and will have a major influence on what happens with the British pound overall. This will be especially interesting when we marry the British pound up to the Japanese yen, as it is a major currency pair for measuring risk appetite. At this point, the market is going to be very sensitive to not only Brexit, but the US-China trade situation too.
That situation has been relatively quiet over the last couple of weeks, which has certainly helped this pair. The Japanese yen is a safety currency, so if things get a bit skittish, the market could break down as traders will start buying the Japanese yen to protect risk.
Looking for value
At the moment, it’s probably best to look for value in this pair, because buyers keep coming in and picking up value as it shows itself in the dips that present themselves. As long as we can stay above the 200-day EMA, it should remain a very bullish market. At this point, the 50-day EMA is ready to reach towards that 200-day EMA.
All things being equal, it looks likely that this market will eventually break out to the upside. However, it will take a certain amount of momentum to make that happen. Perhaps a bit of patience may be needed for those looking to take advantage of the longer-term move.

