Gold markets hang on to support

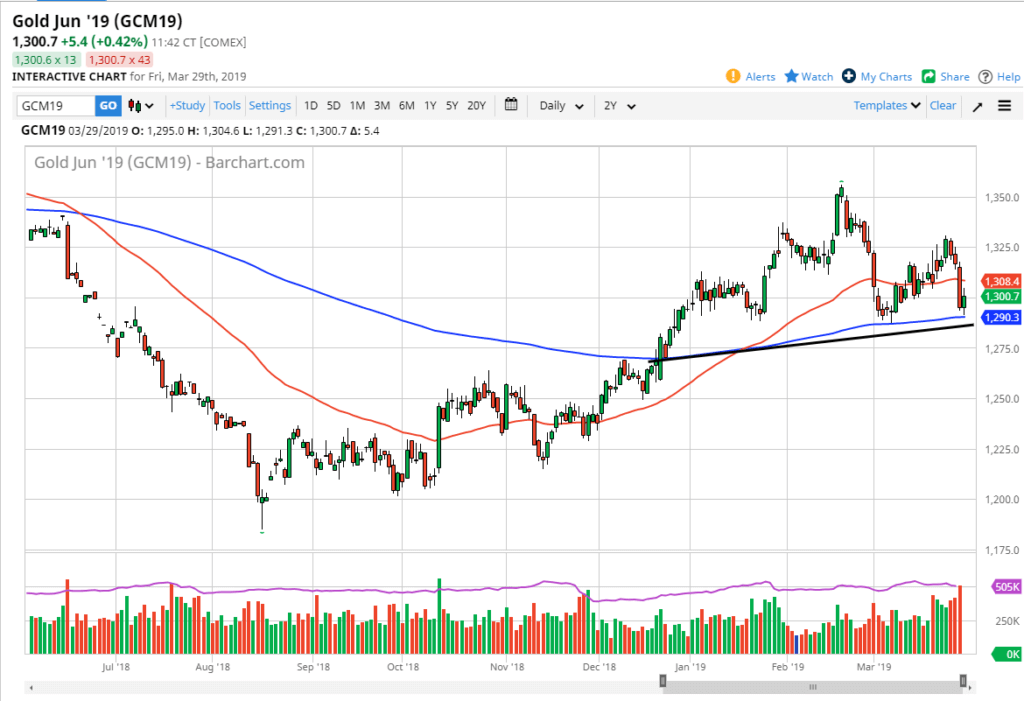
Gold markets pulled back a bit during the trading session on Friday, reaching down towards the vital 200 day EMA. By doing so, it shows signs of continuation, as we approach a major trendline. The question now is whether or not it is a trend line, or is it a neck line?
The greenback
When trading gold, you should always pay attention to the US dollar. During the day on Friday it did see a bit of strength, although it does seem to be decelerating it’s momentum, which is quite likely going to be good for gold in general. If we can break above the top of the candle stick for the trading session on Friday, then it shows a little bit of resiliency that we need to see. After all, we had rallied for quite some time but recently have seen a couple of legs lower.
By hanging onto the uptrend line again, that does show a certain amount of resiliency that could keep this market afloat. Just at the trend line is also a 200 day EMA that of course is going to cause a lot of questions. With that being the case, I do think that there is the possibility of a bounce, but we should keep an eye on the aforementioned 200 day EMA.
Going back to the greenback, if it breaks down below the 1.12 level against the Euro, that would be a sign that we are going to see gold selloff rather drastically, perhaps down to the $1275 level, possibly even down to the $1250 level.

Gold daily
Risk appetite
Obviously, risk appetite comes into play when we talk about precious metals as well. With this being the case, you should keep an eye on how the stock markets are doing. Recently, we have seen the markets go back and forth, and if the stock market suddenly melt down, that could pick up the need for people to run into gold in order to protect wealth. In this situation, you can have both gold and the US dollar rallied, so watching the US dollar isn’t the only thing that you need to do.
Risk to the downside and upside
If we do break down below the trend line, then the $1275 level should offer support, but quite frankly I suspect that it’s only a matter of time before you even lower, perhaps down to the $1250 level which is massively supportive based upon historical charts as well. At this point, if the market does break above the red 50 day EMA, then the $1325 level would be targeted, perhaps even the $1350 level after that.
All things being equal, the market looks very choppy and confused, but we should always keep an eye on where the market could be going given enough time and these are the levels that currently look to be the most likely. Granted, the bigger move would be to the downside due to a break of that trend line, but Gold could very budget up being like stock markets, grinding higher climbing a “wall of worry.”

