Bitcoin to continue testing support

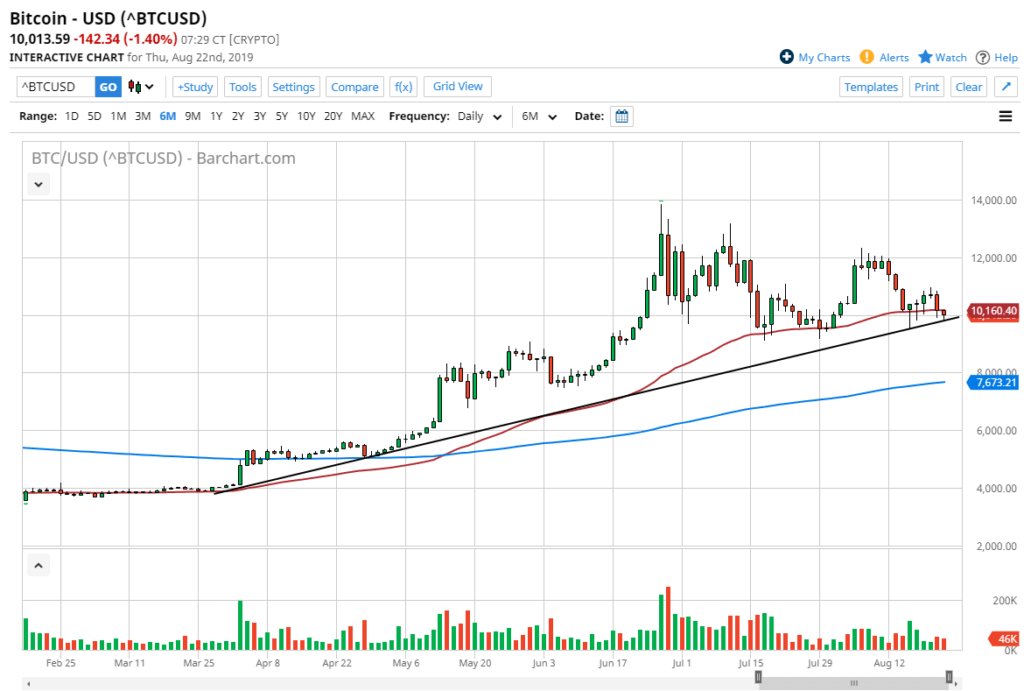
- Bitcoin testing major trendline
- 50 day EMA in focus
- Trend being threatened
The Bitcoin markets have fallen slightly during the trading session on Thursday to kick off another day of tension. We are hanging about the 50 day EMA which of course is crucial, but at the end of the day we will need to see an impulsive candle in one direction or the other to put serious money to work. But frankly, we are at a crossroads and it will be interesting to see how Bitcoin plays out.
Decision needed
Bitcoin needs to make up its mind, and we will see that decision made a rather soon. The uptrend line has been reliable for several months and has been especially crucial over the last few days. We had recently formed several hammers, which of course is a bullish sign, but at this point it’s being threatened as the sellers have come back into play and we find this market dancing around the $10,000 level in general.
If we can get some type of impulsive candle, that can give us a decision that we are looking for. Quite frankly, the last couple of days have been a bit difficult for Bitcoin traders, which makes quite a bit of sense because we have the central bankers around the world meeting in Jackson Hole this week, and therefore a lot of movement could be coming in the fiat currency world, which of course will have a “knock on effect” over here.
Central bank monetary policy and capital flight
Central bank monetary policy, and more specifically central banks around the world easing that monetary policy, has been a major driver of money into the crypto currency markets. The Bitcoin market of course is the largest faction of the cryptocurrency markets, so it makes sense that quite a bit of money has flown into it. Now the question is what will central bankers do going forward?
The other major factor has been capital flight going into the crypto currency markets. At this point, Venezuela has seen money flowing from its borders, just as China and the Islamic Republic of Iran has. Because of this, it makes quite a bit of sense that the markets had seen that boost. However, it seems as if the outflow of wealth has exhausted itself.
Technical analysis

BTC/USD
The technical analysis for this pair sets up as we have a massive uptrend showing support, the $10,000 level of course offering quite a bit of support, and that of course the 50 day EMA driving right through the candle stick. That being said, it still looks rather supported because of the hammers from the earlier candles from several days ago, which of course shows that there is a certain amount of support historically. That being said, if we were to break down below the candle stick at the bottom of those three candles, it will open up selling pressure and drive the market towards the 200 day EMA, pictured in blue. Alternately, if we were to rally from here or if we can clear the candle stick from Tuesday, the market is very likely to go to the $12,000. Pay attention to these levels, they should lead the way going forward.

