New Zealand Dollar Showing Signs of Fatigue Against Yen

- New Zealand dollar forms shooting star on Thursday
- Breaking below candlestick technically a sell signal
- Shoots below 69
- 50-day EMA causes resistance
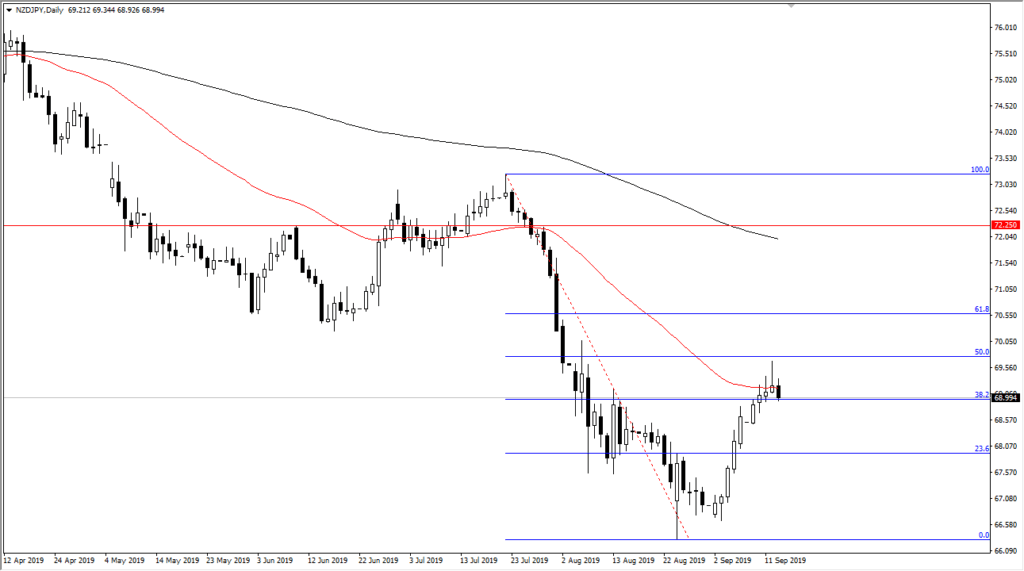
The NZD/JPY pair broke down a bit during the early hours on Friday, after forming a massive shooting star on Thursday. The market has witnessed the 50-day EMA slice through recent price action and cause a certain amount of resistance. At this point, it looks as if the market will go lower, perhaps breaking back down, as the top of the shooting star was at the 50% Fibonacci retracement level. Longer-term it’s likely that the market could then go down to the ¥67 level, which means there is a certain amount of “risk off” out there, as expressed by this risk-sensitive currency pair.
Parabolic move fading

NZD/JPY daily chart
This has been a relatively parabolic move, and it does look as if it is fading a bit. This would make a bit of sense, considering that the market can’t go in one direction forever. With that being the case, it appears that the market is ready to find sellers, especially considering that the 50% Fibonacci retracement level is where buyers were repelled. Quite often, the 50% Fibonacci retracement level is where a lot of traders will step into the market and take advantage of “cheap pricing”.
Keep in mind that the risk appetite can be expressed in several different markets, including the S&P 500, which is trying to break out to the upside. At the same time, you can also make an argument for the fact that we have run out of momentum over there as well. In other words, there may be some profit-taking ahead of the weekend, which makes sense considering how many moving pieces there are out there when it comes to risk.
The trade going forward
At the end of the session, if the NZD/JPY pair is below the ¥69 level, it’s very likely that it will continue to go lower in a bid to reach safety. Recently, we have seen the US/China trade relations warm up a bit. In theory, that should help the situation, but we have also seen those same officials soften their stance only to turn right back around. It’s not hard to imagine a scenario where traders may be a bit wary about being far too overexposed to risk appetite. After all, all it will take is a negative tweet to send risk appetite right back down.
Ultimately, the technical analysis is still negative, and quite frankly there’s an alternate scenario that then becomes bullish. Breaking above the top of the shooting star shows an impulsive move to the upside and opens up the door towards the 61.8% Fibonacci retracement level, which is closer to the ¥70.60 level. So far, it looks as if the sellers are winning the argument, but you should always consider the other scenario as a possible setup.

